VOLUME 8 NUMBER 3 • SEPTEMBER 2011
115
SA JOURNAL OF DIABETES & VASCULAR DISEASE
DIABETES EDUCATOR’S FOCUS
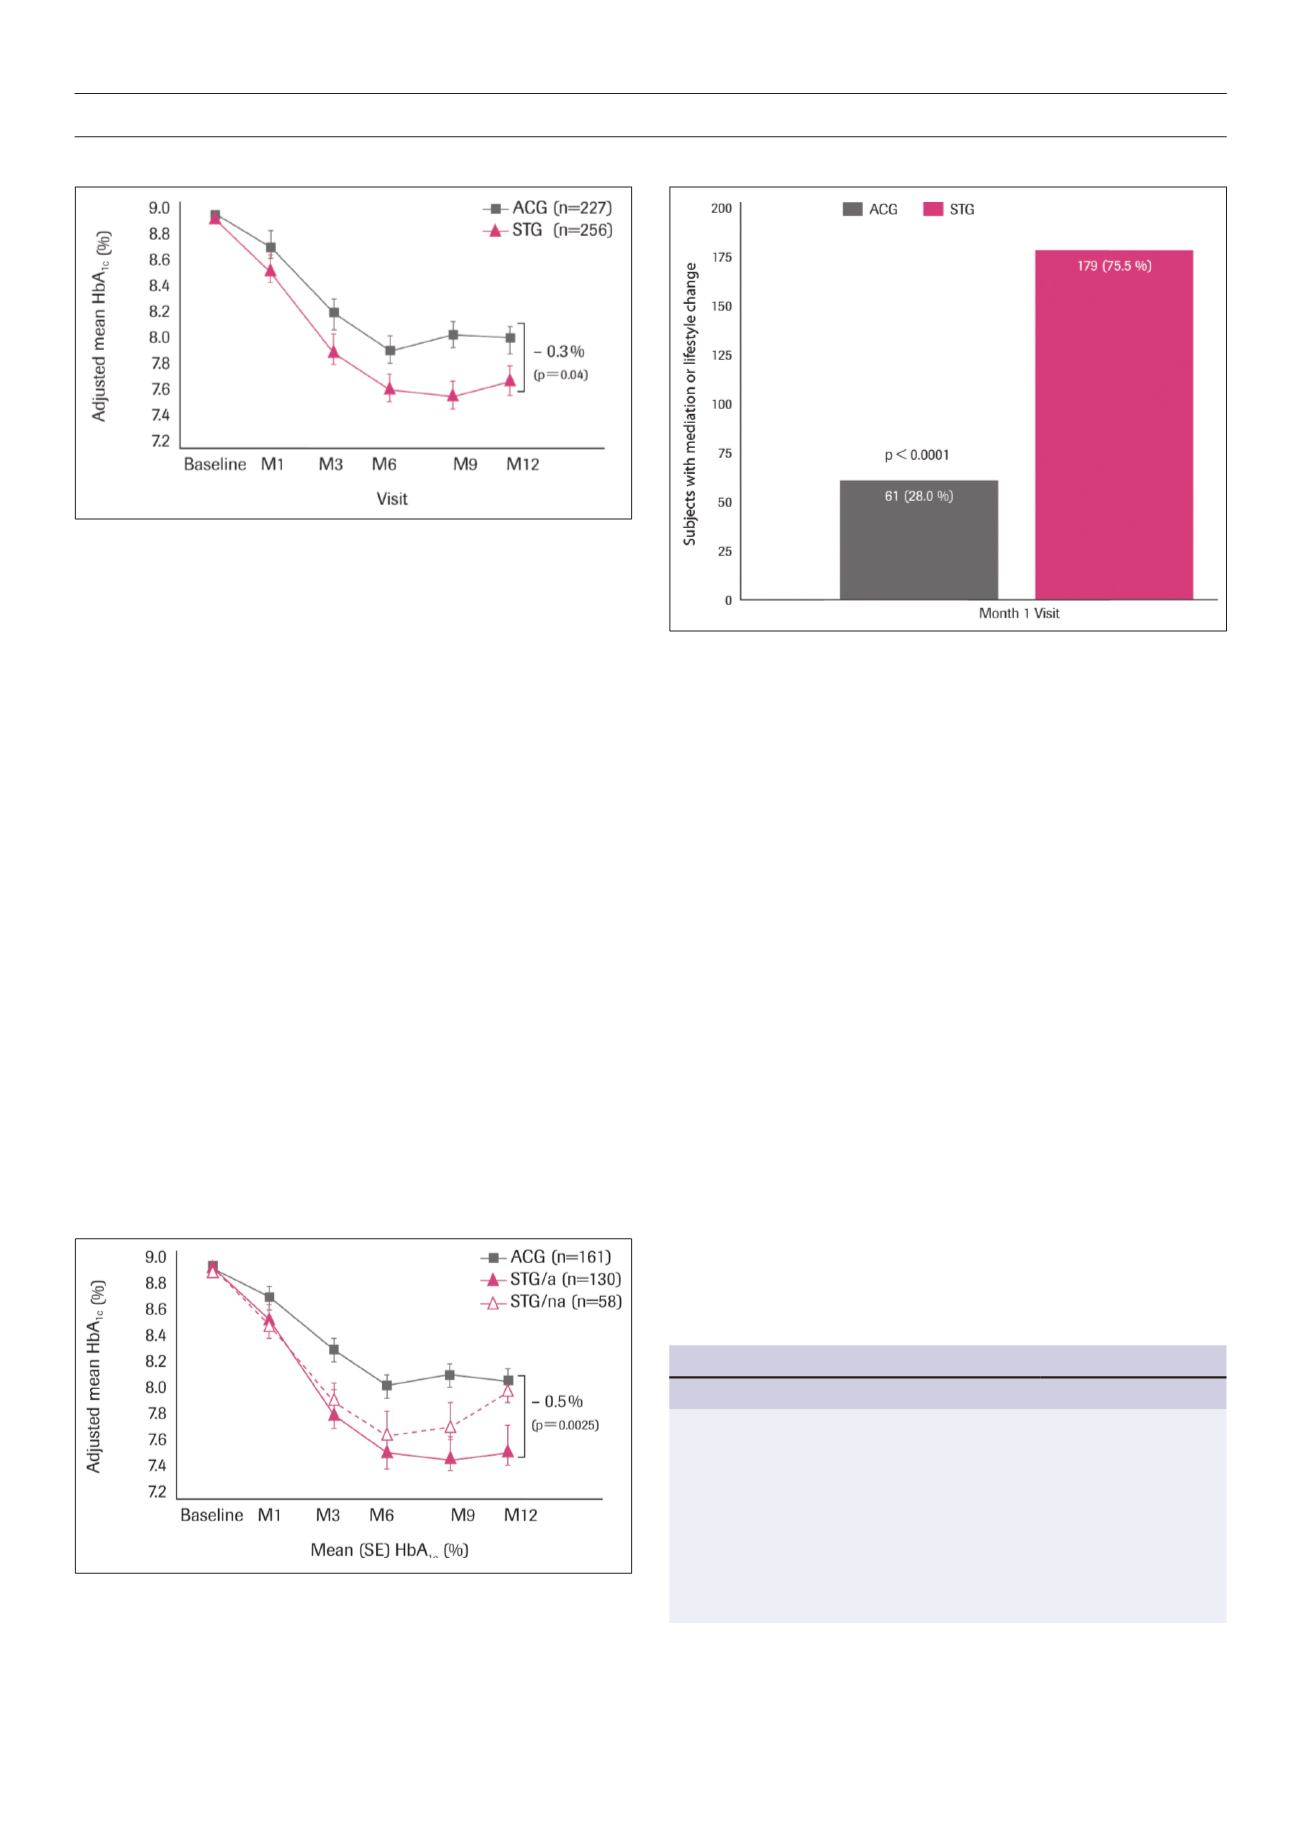
Fig. 1.
Intention-to-treat (ITT) analysis: Change in mean HbA
1c
over 12
months in patients with non-insulin-treated type 2 diabetes, according to
randomisation group.
Fig. 2.
Per-protocol (PP) analysis: Change in mean HbA1c over 12
months in patients with non-insulin treated type 2 diabetes.
Fig. 3.
Intent-to-treat analysis: Comparison of the number of patients who
received treatment change at month 1 by study group.
Table 4.
Recommendation for test frequency as done in my own practice.
Treatment
Tests per day
Strips per month
Intensive insulin
Three times
100
Premix insulin
Twice
50
Basal insulin
Once or less, vary
25
Combination orals
Once or less, vary
25
Low-risk orals*
None if HbA
1c
< 6.5%
or twice per week
0–12
*Metformin or DDP-IV inhibitor or the combination.
who had a baseline visit and one additional visit (
n
= 483). It
showed 0.3% improvement in the STG versus the ACG (
p
=
0.04), which was a statically significant improvement (Fig. 1).
When this analysis was repeated in the per-protocol analysis
(
n
= 291), including all patients who were more than 80%
adherent to the study protocol, the HbA
1c
difference was 0.5%
in favour of the STG (
p
= 0.0025) (Fig. 2). As in many of the
other SMBG studies, the dropout rate of patients in the per-
protocol analysis compared to the ITT analysis was noted.
The STG group had earlier changes made to their treatment,
as well as earlier initiation of insulin (Fig. 3). It is interesting to
note that the STG, doing seven-point profiles for three consec-
utive days, used fewer strips than the ACG in the ITT analysis.
General well being and depression scores were analysed
and found to have improved from the beginning of the study
in both groups, but more so in the STG. The STeP results were
therefore contrary to the results of the DiGEM
5
and ESMON
4
trials published in 2007 and 2008, respectively.
The STeP study is one of the best thus far on SMBG in
non-insulin-treated type 2 diabetes and confirms with little
doubt the benefit of SMBG. The difference was that there
was clear-cut analysis of the SMBG results and changes were
made appropriately, confirming the notion that testing with-
out analysis and action is futile.
Where cost is concerned, it is important to check whether
patients use the prescribed strips, and health professionals
should download the results from the glucose-monitoring
devices. In my opinion, glucose-monitoring devices without
the option of downloading the data should not be used.
Most of the devices are very accurate and there is a wide
variety available. There is also a large variation in the cost
of strips.
It is important when using SMBG to vary the time of test-
ing, particularly if good values are confirmed, for example,
on fasting results. Then pre-lunch and pre-supper values
should also be checked.
Table 4 gives recommendations regarding testing fre-
quency in type 2 diabetics on different treatment regimes
and the predicted number of strips used. One can see that
there is variation in the recommended usage and the number
of strips used, so the frequency of testing should be individu-
alised. HbA
1c
level may also influence frequency of testing,
and patients with good glycaemic control on recurrent test-


