


 40 / 48

38
VOLUME 12 NUMBER 1 • JULY 2015
RESEARCH ARTICLE
SA JOURNAL OF DIABETES & VASCULAR DISEASE
(Table 4), there was no significant relationship of these factors with
the metabolic syndrome in both sexes.
In individuals diagnosed with the metabolic syndrome from
the JIS definition (
n
= 171), the most frequent components were
elevated blood pressure: 52.5% (men 55.4% vs women 49.82%,
p
= 0.165), reduced HDL-C levels: 50.1% (men 36.7% vs women
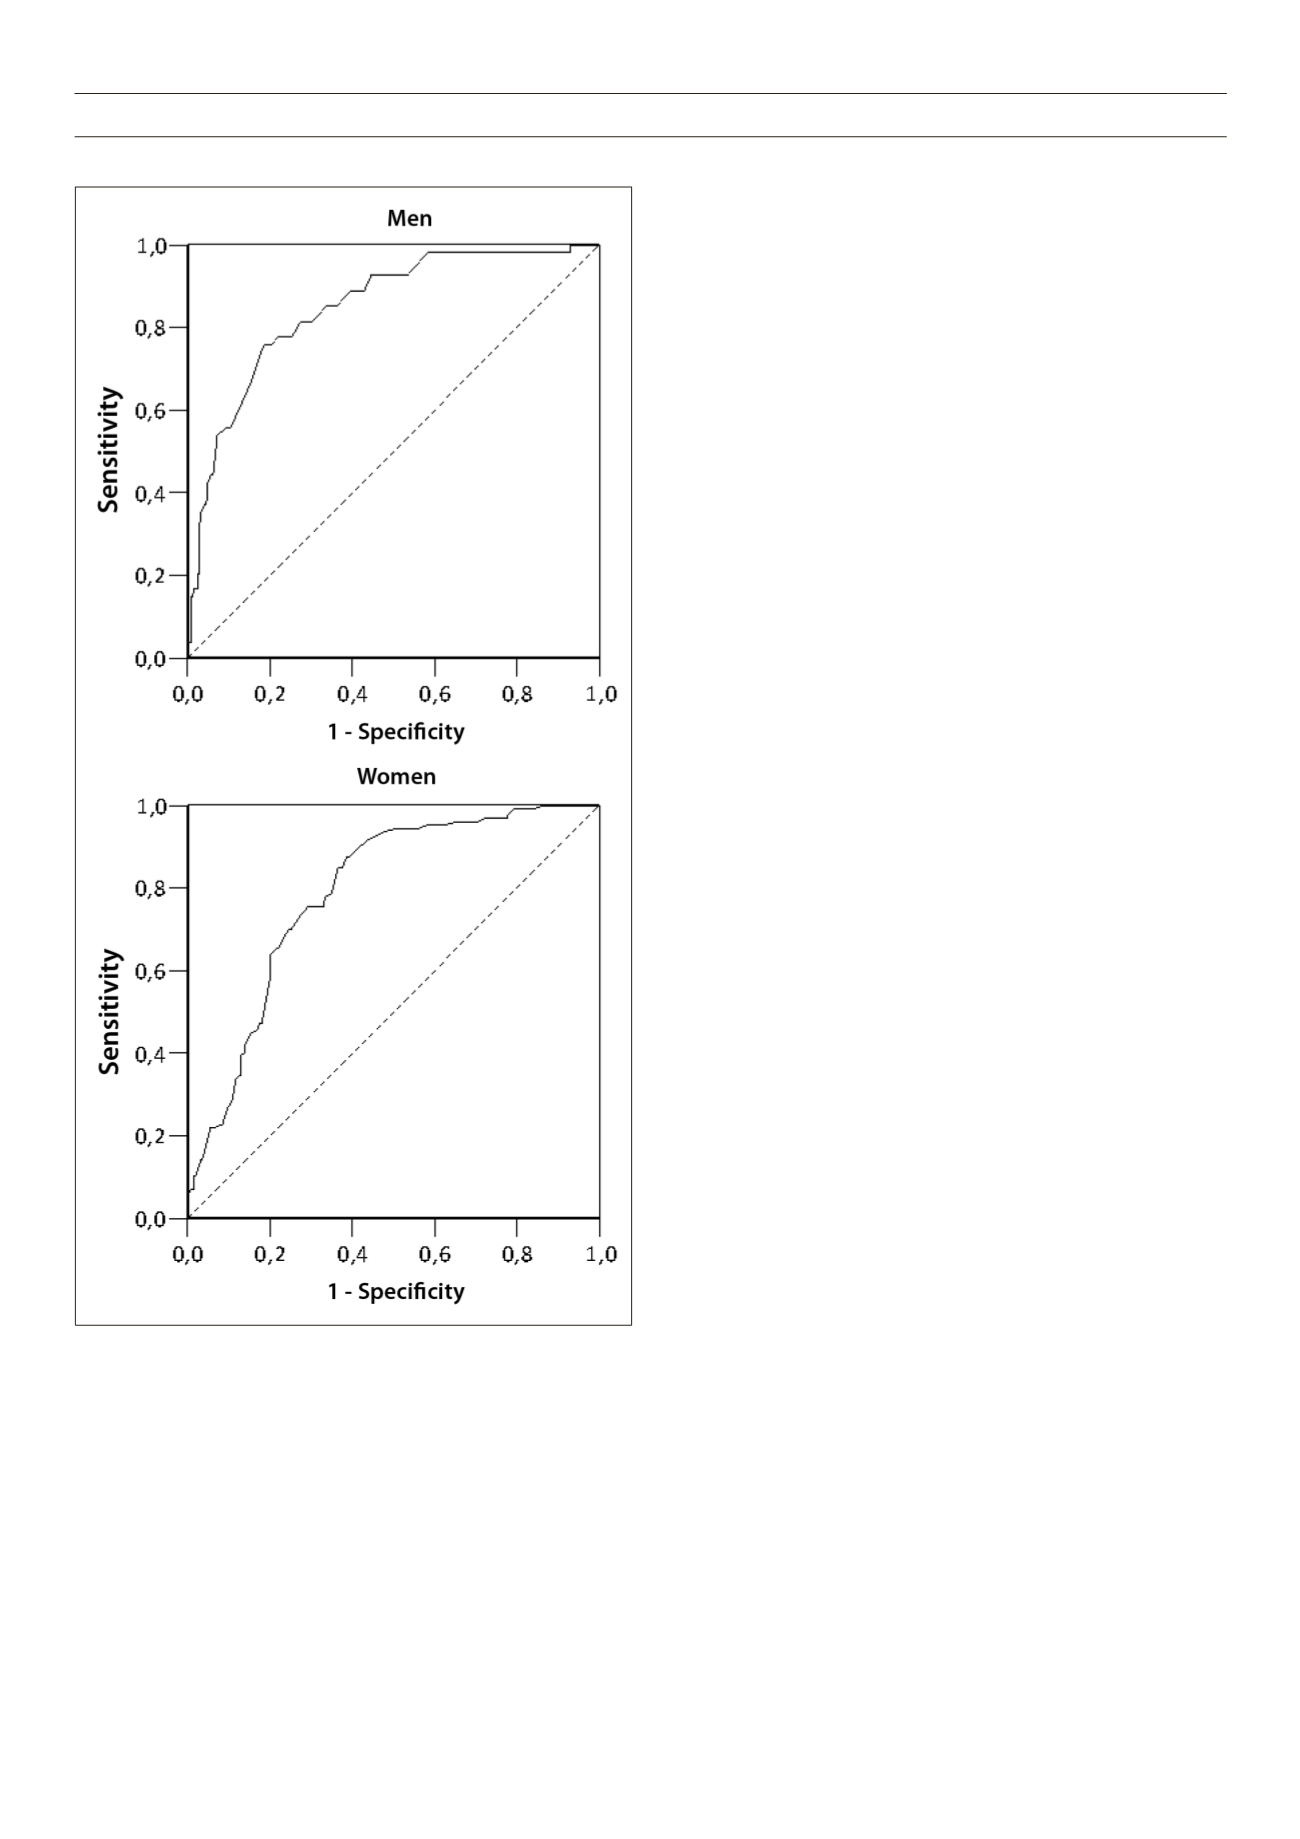
Fig. 1.
Receiver operating characteristic (ROC) curves of waist circumference
(WC) to detect the metabolic syndrome in men and women, according to the
Joint Interim Statement definition. Area under the ROC curve: 0.85 in men and
0.79 in women. WC cut-off values in men: 87.5 cm (sensitivity 75.9%, specificity
81.2%) and 80.5 cm (sensitivity 88.4%, specificity 60.5%) in women.
62.3%,
p
< 0.001) and high WC: 39.8% (men 15.3% vs women
62.3%,
p
< 0.001). The less frequent components were elevated
glucose levels: 23.4% (men 25.9% vs women 21.2%,
p
= 0.172)
and raised triglyceride levels: 10.7% (men 12.6% vs women 9.0%,
p
= 0.155).
Although the prevalence of the metabolic syndrome diagnosed
from the JIS criteria was higher than with the ATP III criteria, there
was a good agreement between the two classifications in the overall
sample [kappa = 0.712, (
p
< 0.001; 95% CI: 0.648–0.777)], as well
as in men [kappa = 0.624 (
p
< 0.001; 95% CI: 0.493–0.755)] and
in women [kappa = 0.731 (
p
< 0.001; 95% CI: 0.654–0.809)].
Fig. 1 shows results from the ROC curve analysis to identify
subjects with two or more components of the metabolic syndrome
using the JIS criteria. In men, the optimal cut-off value of WC to
detect the metabolic syndrome with maximum sensitivity and
specificity (Youden index = 0.563) was 87.5 cm (sensitivity 75.9%,
95% CI: 62.4–86.5; specificity 81.2%, 95% CI: 75.7–86; positive
predictive value (PPV) 44.2%, 95% CI: 38.5–49.9 and negative
predictive value (NPV) 94.2%, 95% CI: 91.5–96.9); whereas in
women, the optimal cut-off value of WC (Youden index = 0.489)
was 80.5
cm (sensitivity 88.4%, 95% CI: 81.3–93.5; specificity
60.5%, 95% CI: 53.4–67.3; PPV 57.5%, 95% CI: 52.1–62.9 and
NPV 89.6%, 95% CI: 87.9–91.3).
There was good accuracy (
p
< 0.001) of the cut-off values of
the WC to predict other components of the metabolic syndrome,
as suggested by values of the area under the ROC curve [men: 0.85
(95% CI: 0.80–0.89) and women: 0.79 (95% CI: 0.74–0.84)].
Discussion
The main findings of this study were a high prevalence of the
metabolic syndrome among our subjects and a different cut-
off value for WC for the diagnosis of the metabolic syndrome
from those recommended for Africans by other studies.
5,7
To our
knowledge, this is the first study reporting the prevalence of the
metabolic syndrome in Angolans.
Worldwide, the metabolic syndrome is increasingly becoming a
pandemic,
7
the level of prevalence being estimated to be 17–25% in
the general population. However, estimates in sub-Saharan African
populations are scarce and inaccurate.
11
The crude prevalence in this
study was in an intermediate point of the range (0–50%) reported
for different African populations.
11
The three most frequent components of the metabolic syndrome
were elevated blood pressure, low HDL-C levels and elevated WC. A
similar cluster of components was reported in an urban population in
Kenya,
20
and in a study including West Africans (Nigeria and Ghana)
and African-Americans.
34
Other studies reported a combination of
high WC and low HDL-C levels as the most frequent components
in Africans with high a prevalence of the metabolic syndrome.
14,18,25
Although the underlying mechanisms are not fully understood,
the increasing prevalence of the metabolic syndrome has been
associated with a sedentary lifestyle and obesity.
7
Also, it has been
reported that in contrast to developed nations, in some African
nations, a higher socio-economic status has been associated
positively with increased obesity.
3
5
In our study, distribution of the metabolic syndrome according
to socio-economic class, defined by average household monthly
income, was not significant. However, this study also showed a
high prevalence of both obesity and overweight (47.8%) and
hypertension (45.2%). The three most common components