
RESEARCH ARTICLE
SA JOURNAL OF DIABETES & VASCULAR DISEASE
20
VOLUME 16 NUMBER 1 • JULY 2019
Obesity is a risk factor for cardiovascular diseases such as
hypertension and type 2 diabetes, and it is a global public health
concern.
13
Van Den Ende
et al
.
9
reported a low prevalence of
overweight and obesity among the same sample at a younger
age (7–15 years). The present study revealed a high prevalence of
obesity (3–26%) and overweight (9–23%) as the ELS sample grew
older. This is a serious concern.
The findings are in line with other studies in Africa and the
prevalence of overweight and obesity continues to increase,
with from 25 to 60% of urban females being overweight.
3,4
The
influence of a Western diet together with low levels of physical
activity, particularly among women, as reported by Sekgala
et al
.,
10
Mchiza
et al
.
6
and Jaffer
et al
.
7
among the South African population,
could be contributing to this escalating high prevalence of obesity
and overweight.
Furthermore, several studies have reported the overconsumption
of macronutrients to be one of the leading causes of the high
prevalence of overweight and obesity among the adult Saudi
population.
19,20
An increase in urbanisation, in terms of social,
political and economic factors, explains the dietary transition in
South Africa among females.
21
It is projected that the population
of overweight and obesity worldwide will increase to 2.3 billion for
overweight and 700 million for obesity.
3
According to the Global
Burden of Metabolic Risk Factors of Chronic Diseases Collaboration
Group, 9.1 million adults are affected with overweight and obesity.
22
This has caused the tendency of overweight and obesity to double
worldwide.
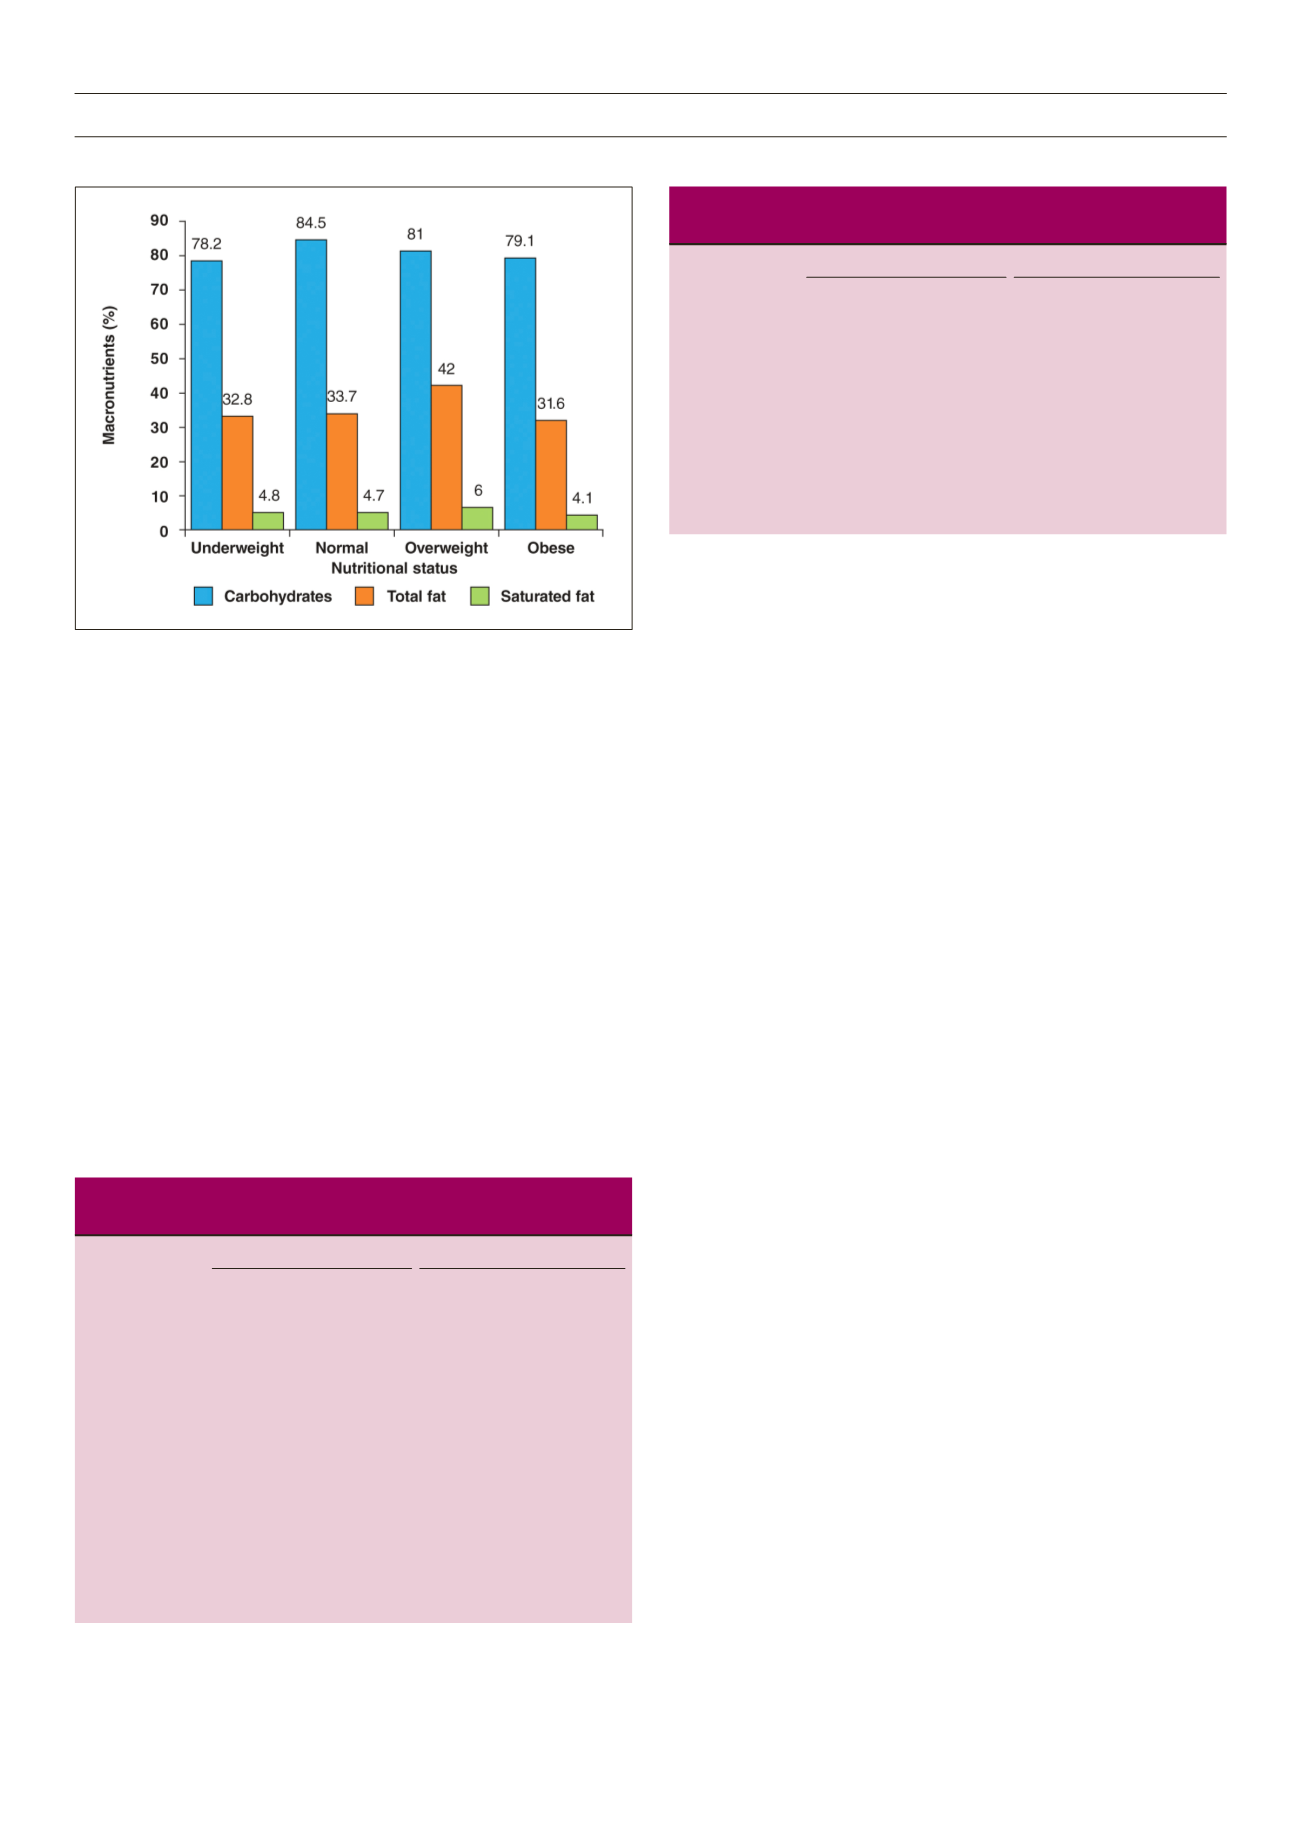
The intake of carbohydrates and fats in the present study was
higher than that reported by Van Den Ende
et al
.9 in the same sample
at a younger age. Singh
et al
.
2
recommended 60% carbohydrate,
30% total fats and 10% protein as the total daily kilocalories for
an individual. The high consumption of fats in our study therefore
reveals that there is a peak in the nutritional transition, and weight
status has therefore changed among Ellisras females. The high
intake of saturated fat reported in this study is in agreement with
that in healthy young adults in Saudi Arabia.
23
The significant association between dietary intake and BMI
predicts that the higher the percentage of kilojoules, the higher the
risk of overweight and obesity. This finding is consistent with Van
Den Ende
et al
.
9
Sengwayo
et al
.
3
found a significant association
of dyslipidaemia with high BMI among females in Limpopo. This is
associated with a shift in the nutritional pattern, which predisposes to
the development of atherosclerosis due to a high cholesterol intake.
A limitation of this study is the cross-sectional design, which does
not allow an analysis of cause and effect regarding the association
between BMI and dietary intake. Also we did not consider blood
sample analysis to support the findings of dietary intake. However,
Steyn
et al
.
21
confirm that dietary intake can be reliably evaluated
by assessing the macronutrient intake. All anthropometric data
were measured, not self-reported by the participants, which allows
the comparison of our study with other studies in South Africa
to be accurate.
4,21
Furthermore, we used intervieweradministered
questionnaires, which are more effective than a self-administered
questionnaire.
5
Conclusions
There was a high prevalence of overweight and obesity among
rural Ellisras females. Cholesterol intake was associated with a
raised BMI in the overall sample. Therefore, dietary knowledge and
access to resources are important to improve health and nutrition in
a sustainable way. The need to assess the changes that occur over
Fig. 3.
Descriptive statistics for 24-hour recall of dietary intake by nutritional
status of young rural Ellisras adults aged 18–30 years.
Table 2.
Linear regression coefficient, 95% CI and p-value in the
association with body mass index and dietary intake
Unadjusted
Adjusted (age and gender)
BMI variables
β
95% CI
p
-value
β
95% CI
p
-value
Total fat
–0.002 –0.011 0.007 0.665 –0.001 –0.010 0.007 0.738
Animal protein
0.000 –0.016 0.015 0.988 0.004 –0.010 0.018 0.538
Plant protein
–0.001 –0.041 0.038 0.951 0.008 –0.028 0.044 0.667
Total sugar
0.009 –0.010 0.028 0.366 –0.002 –0.019 0.015 0.827
Carbohydrates
0.001 –0.002 0.004 0.545 0.001 –0.002 0.004 0.459
Total dietary fibre 0.016 –0.040 0.073 0.570 0.019 –0.032 0.071 0.460
Total protein
0.000 –0.013 0.014 0.972 0.005 –0.007 0.017 0.451
Cholesterol intake 0.002 0.000 0.004 0.058 0.002 0.000 0.004 0.035*
Mono-unsaturated
fatty acids
–0.008 –0.032 0.016 0.527 –0.005 –0.027 0.016 0.634
Polyunsaturated
fatty acids
–0.002 –0.033 0.028 0.876 –0.002 –0.029 0.026 0.899
Saturated fatty
acids
–0.007 –0.033 0.019 0.600 –0.007 –0.030 0.017 0.583
CI: confidence interval,
β
: beta-coefficient. *Significant at
p
< 0.05.
Table 3.
Logistic regression for the association between overweight/
obesity and low dietary intake
Unadjusted
Adjusted for age and gender
Variable
OR
95% CI
p
-value OR
95% CI
p
-value
Overweight/obesity
Total fat
0.78 0.56 1.10 0.154 0.86 0.59 1.22 0.430
Total sugar
1.18 0.67 2.08 0.561 0.96 0.52 1.78 0.900
Saturated fat
1.23 0.89 1.69 0.215 1.32 0.924 1.894 0.127
Mono-unsaturated
fat
0.61 0.20 1.88 0.388
0.48 0.14 1.694 0.255
Polyunsaturated
fat
1.48 0.25 8.93 0.668 1.46 0.20 10.81 0.708
Cholesterol intake 1.43 0.95 2.16 0.084 1.73 1.09 2.75 0.020*
OR: odds ratio; CI: confidence interval. *Significant at
p
< 0.05.


