


 40 / 56

38
VOLUME 13 NUMBER 1 • JULY 2016
RESEARCH ARTICLE
SA JOURNAL OF DIABETES & VASCULAR DISEASE
detection, evaluation, and treatment of high blood cholesterol in
adults (Adult Treatment Panel III) (ATP III, 2001),
6
followed by the
ATP III as modified in 2005,
7
were used, plus the modified version
specific to the people of south Asian origin (ATP III SAS 2009).
8-10
These criteria were as follows:
• waist circumference: male > 90 cm; female > 80 cm
• triglycerides: ≥ 2.25 mmol/l
• HDL: male < 1.03 mmol/l; female < 1.28 mmol/l
• blood pressure: SBP ≥ 130 mmHg and/or DBP ≥ 85 mmHg
• fasting blood glucose: ≥ 5.56 mmol/l.
Statistical analyses
Parameters were expressed as mean and standard deviation
(SD), separately for males and females in the study population.
The prevalence (%) of the MS and its confounding factors were
calculated using standard cut-off values. All statistical analyses
were performed using SPSS (PC + version 10.0).
Results
The mean and standard deviation by gender of obesity values,
lipid profiles and blood pressure is presented in Table 1. It was
observed that males had significantly (
p
< 0.05) higher mean
total cholesterol and fasting blood glucose values (
p
< 0.05) than
females.
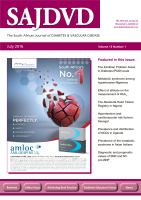
Table 2.
Prevalence (%) of metabolic syndrome phenotypes by
definitions
Factors
ATP III 2001 ATP III 2005 SAS 2009
WC
30.9
61.1
61.1
TG
39.7
39.7
2.3
HDL
50.9
50.9
50.9
BP
63.7
63.7
63.7
FBG
10.0
21.7
21.7
Metabolic syndrome (%)
32.3
48.3
31.4
SAS = South Asian specific.
The difference in prevalence of the MS according to the three
definitions is presented in Table 2. Using the original ATP III (2001)
definition, the overall prevalence of the MS in the study was
found to be 32.3%. However, according to the ATP III modified
criteria (2005), the prevalence was found to be 48.3% among
the participants. When the south Asian-specific cut-off values
were taken into consideration, the prevalence was found to be
31.4%.
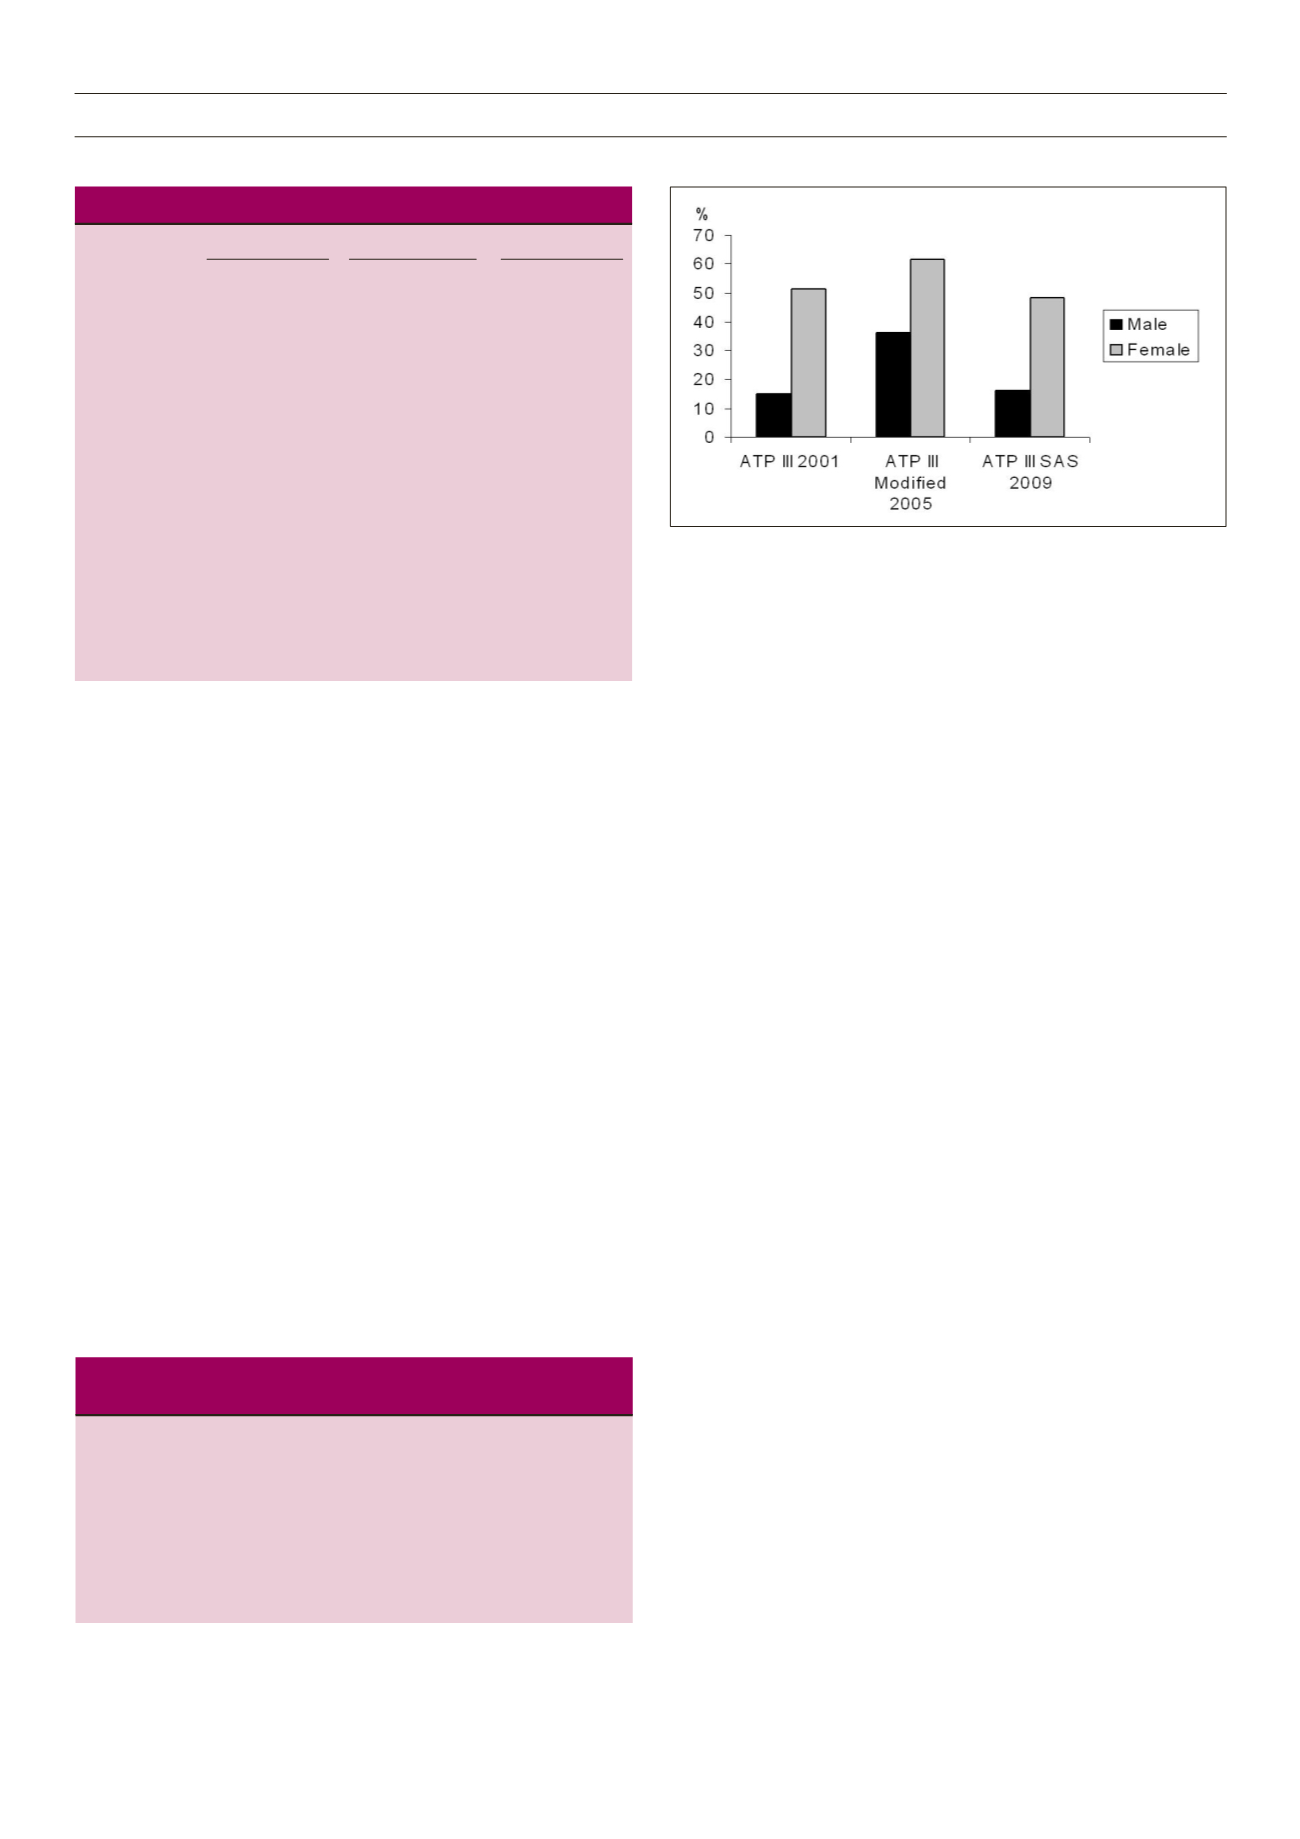
Out of five confounding factors, the three factors playing a
crucial role were high abdominal obesity (61.1%), low HDL
cholesterol (50.9%) and high blood pressure (63.7%). It was also
observed that for all three definitions (NCEP ATP III 2001, ATP III
modified 2005, and ATP III SAS 2009), female participants had
a considerably higher prevalence of the MS compared to male
subjects (Fig. 1).
Discussion
It was observed that the prevalence of the MS was different,
depending on the three definitions used. Moreover, the prevalence
of elevated triglyceride levels (hypertriglyceridaemia), which is a
distinctive feature of people of Indian origin, varied considerably
in the study population owing to the use of the south Asian-
specific cut-off value for elevated triglycerides. The marked
difference in the overall prevalence of the MS from the ATP III
(2005) definition to the SAS (2009) definition (48.3 vs 31.4%)
was due to the use of the south Asian-specific cut-off values for
WC and triglyceride levels. Importantly, whether the modified
ATP III (2005) or the revised SAS (2009) definition is used, a large
number of individuals are likely to be misclassified due to lack of
a common minimum criterion required to better comprehend the
problem of the MS among Asian Indians.
Several other studies have shown such discrepancies, not
only in the Indian population but also in other Asian countries,
such as China and Iran. In a study from India,
10
the World Health
Organisation (WHO), ATP III and IDF criteria of the MS identified
a differential prevalence of the MS in the study population. The
WHO criteria identified a greater number of coronary artery
disease (CAD) subjects in males, but not in females.
10
Studies pertaining to Asian Indians revealed that the ATP III
criteria identified a significantly higher proportion of people with
the MS compared with the WHO criteria.
11,12
It was mentioned
that lower cut-off values of WC and BMI to define the MS
might be critical for the accurate assessment of the MS among
Fig. 1.
Prevalence of the metabolic syndrome by definitions and gender.
Table 1.
Descriptive statistics of the study population (
n
= 350)
Male (
n
= 184) Female (
n
= 166) Total (
n
= 350)
Variables Mean SD Mean SD Mean SD
Age (years)** 54.04 12.40 48.48 11.57 51.40 12.31
BMI (kg/m
2
)
22.37 4.09 23.20 4.37 22.76 4.24
WC (cm)
89.81 10.04 88.90 9.69 89.38 9.87
SBP (mmHg)
132.97 24.02 137.21 24.52 134.98 24.31
DBP (mmHg)
82.22 11.41 83.48 10.55 82.82 11.01
TC (mmol/l)*
2.23 0.31 2.24 0.26 2.27 0.29
TG (mmol/l)
1.61 0.30 1.57 0.25 1.59 0.28
HDL (mmol/l)
1.13 0.12 1.13 0.11 1.13 0.12
LDL (mmol/l)
3.39 0.70 3.25 0.59 3.32 0.65
VLDL (mmol/l)
0.32 0.006 0.31 0.005 0.31 0.005
FBG (mmol/l)** 5.17 1.30 4.92 0.93 5.05 1.15
BMI = body mass index; WC = waist circumference; WHR = waist–hip ratio;
SBP = systolic blood pressure; DBP = diastolic blood pressure; TC = total
cholesterol; TG = triglyceride; HDL = high-density lipoprotein; LDL = low-
density lipoprotein; VLDL = very low-density lipoprotein; FBG = fasting blood
glucose.
Significant gender difference at *
p
< 0.05; **
p
< 0.01.