


 35 / 56

VOLUME 13 NUMBER 1 • JULY 2016
33
SA JOURNAL OF DIABETES & VASCULAR DISEASE
RESEARCH ARTICLE
Health Organisation (WHO), a smoker with a daily consumption of
more than 20 cigarettes.
Statistical analysis
Data were collected manually using case record forms (CRFs),
captured into epi-data and later transferred to STATA version 10 for
analysis. Values are expressed as percentages of total respondents.
Simple bivariate analysis was used to analyse the data. Priority was
given to practical benefit and clinical significance in interpreting
statistically significant data. Statistical significance was set at
p
<
0.05.
Results
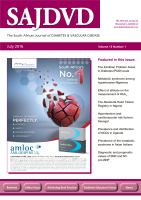
A total of 611 eligible adults were selected and approached to
participate in the survey. Of these, 93 (15.22%) refused while
518 (84.87%) consented to take part in the survey. Of the 518
participants who took part, 56% were female and 29% had no
formal education, while 41% had primary school education. BP,
and fasting blood sugar and total cholesterol levels were measured
in 100, 25.7 and 27.8%, respectively of the 518 participants
(Fig. 1, Table 1).
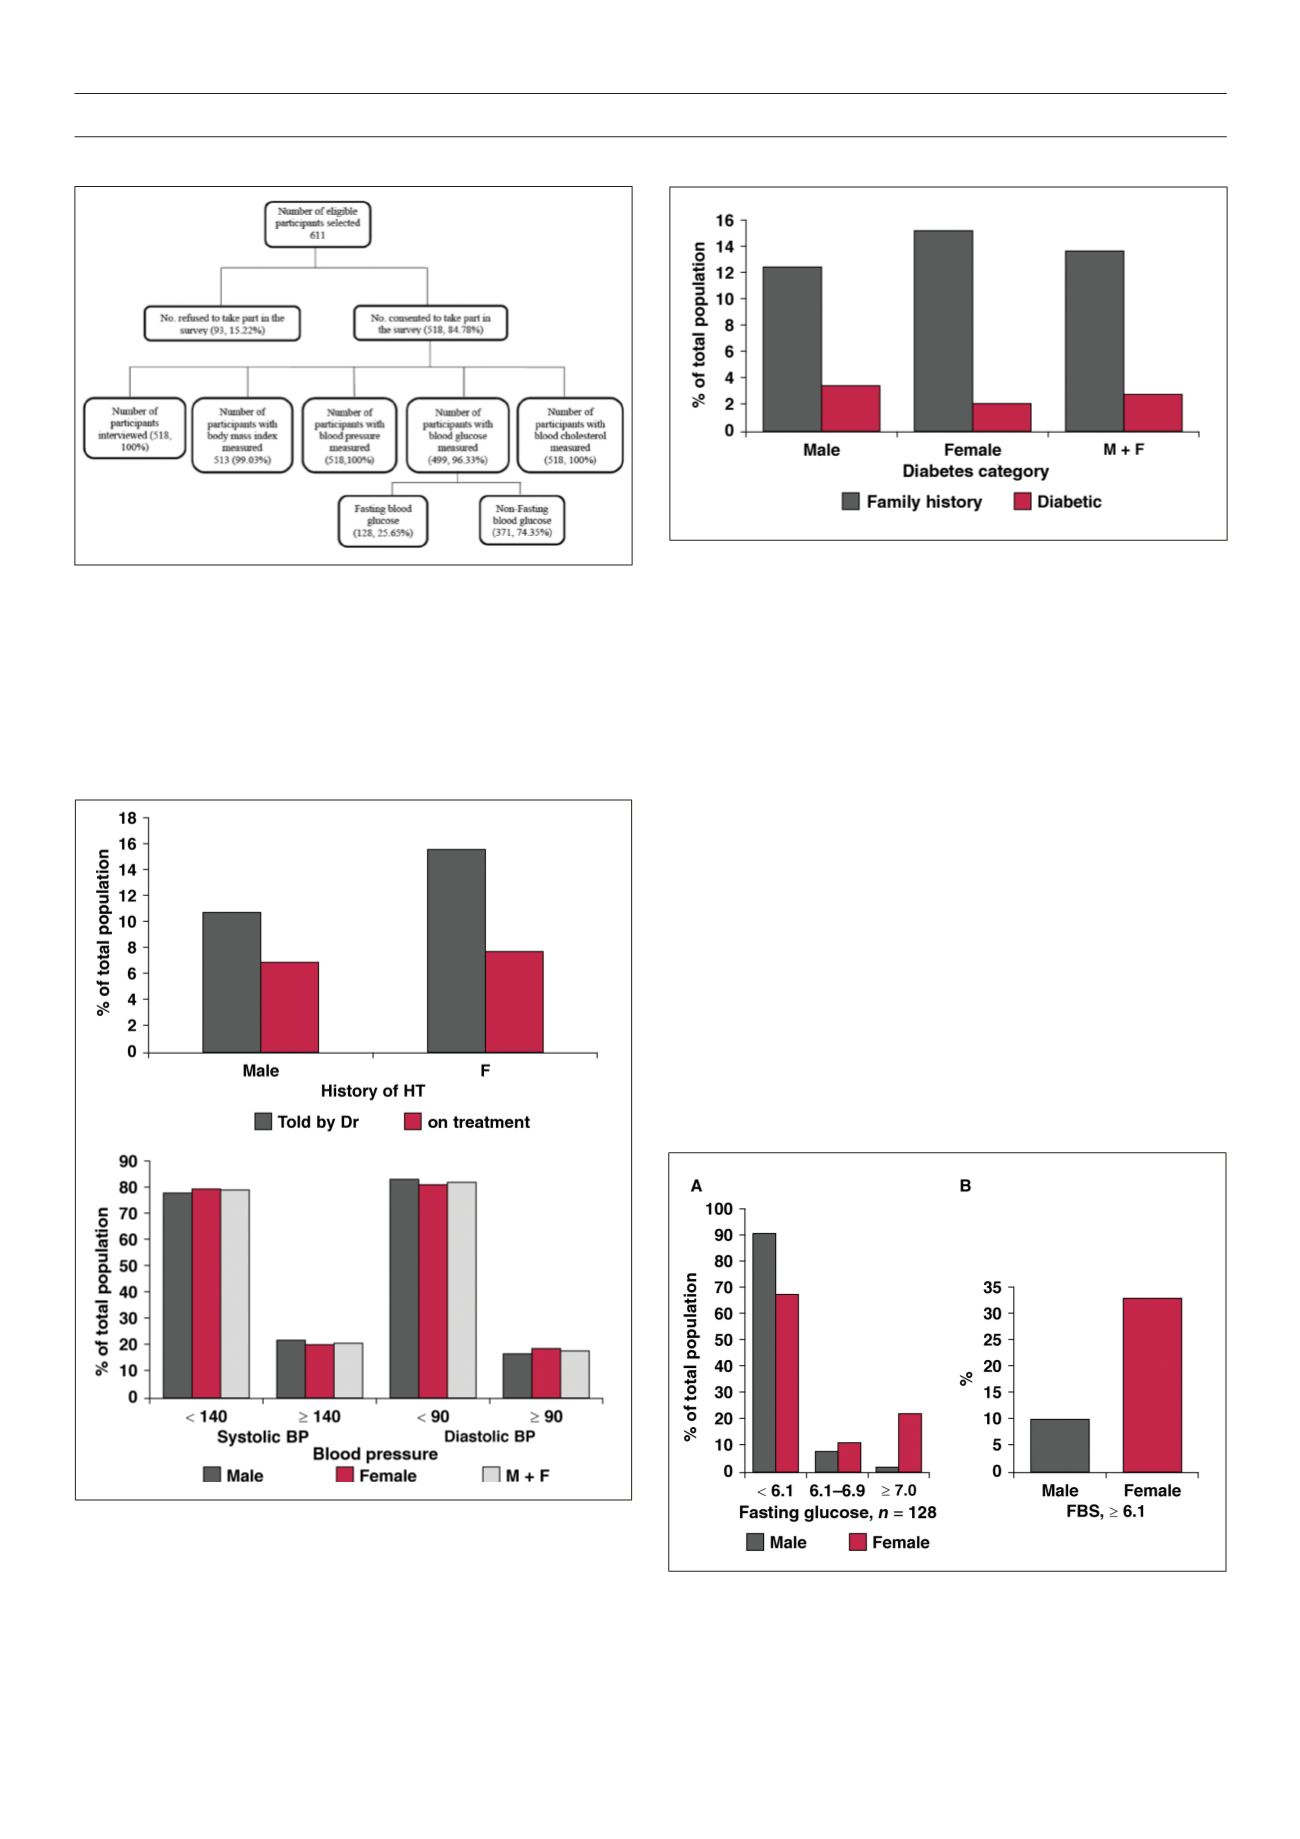
Sixteen per cent of females and 11% of males were told by
the doctor that they had hypertension, while only 8% of females
and 7% of males with diagnosed hypertension were currently on
medication for hypertension (Fig. 2). Twenty per cent of females
had SBP ≥ 140 mmHg and 20% had DBP ≥ 90 mmHg; while 22%
Figure 1.
Flow diagram.
Figure 2A.
History of hypertension (HT) and treatment status; 11% of males
knew of their hypertension, 7% were on treatment; 16% of females knew of
their hypertension, 8% were on treatment.
Figure 2B.
Systolic and diastolic BP; 21% of the population had SBP ≥
140 mmHg; 18% of the population had DBP of ≥ 90 mmHg.
Figure 3.
Family history of DM and on treatment for DM; 13.9% of the
total study population had a family history of DM; 2.9% were diabetic.
Figure 4.
Fasting blood sugar (FBS). A) 19% had FBS 6.1–6.9; 9% ≥ 7.0
mmol/l. B) 31% female FBS ≥ 6.1, 10% Male ≥ 6.1 mmol/l.
A
B