


 10 / 52

RESEARCH ARTICLE
SA JOURNAL OF DIABETES & VASCULAR DISEASE
48
VOLUME 15 NUMBER 2 • NOVEMBER 2018
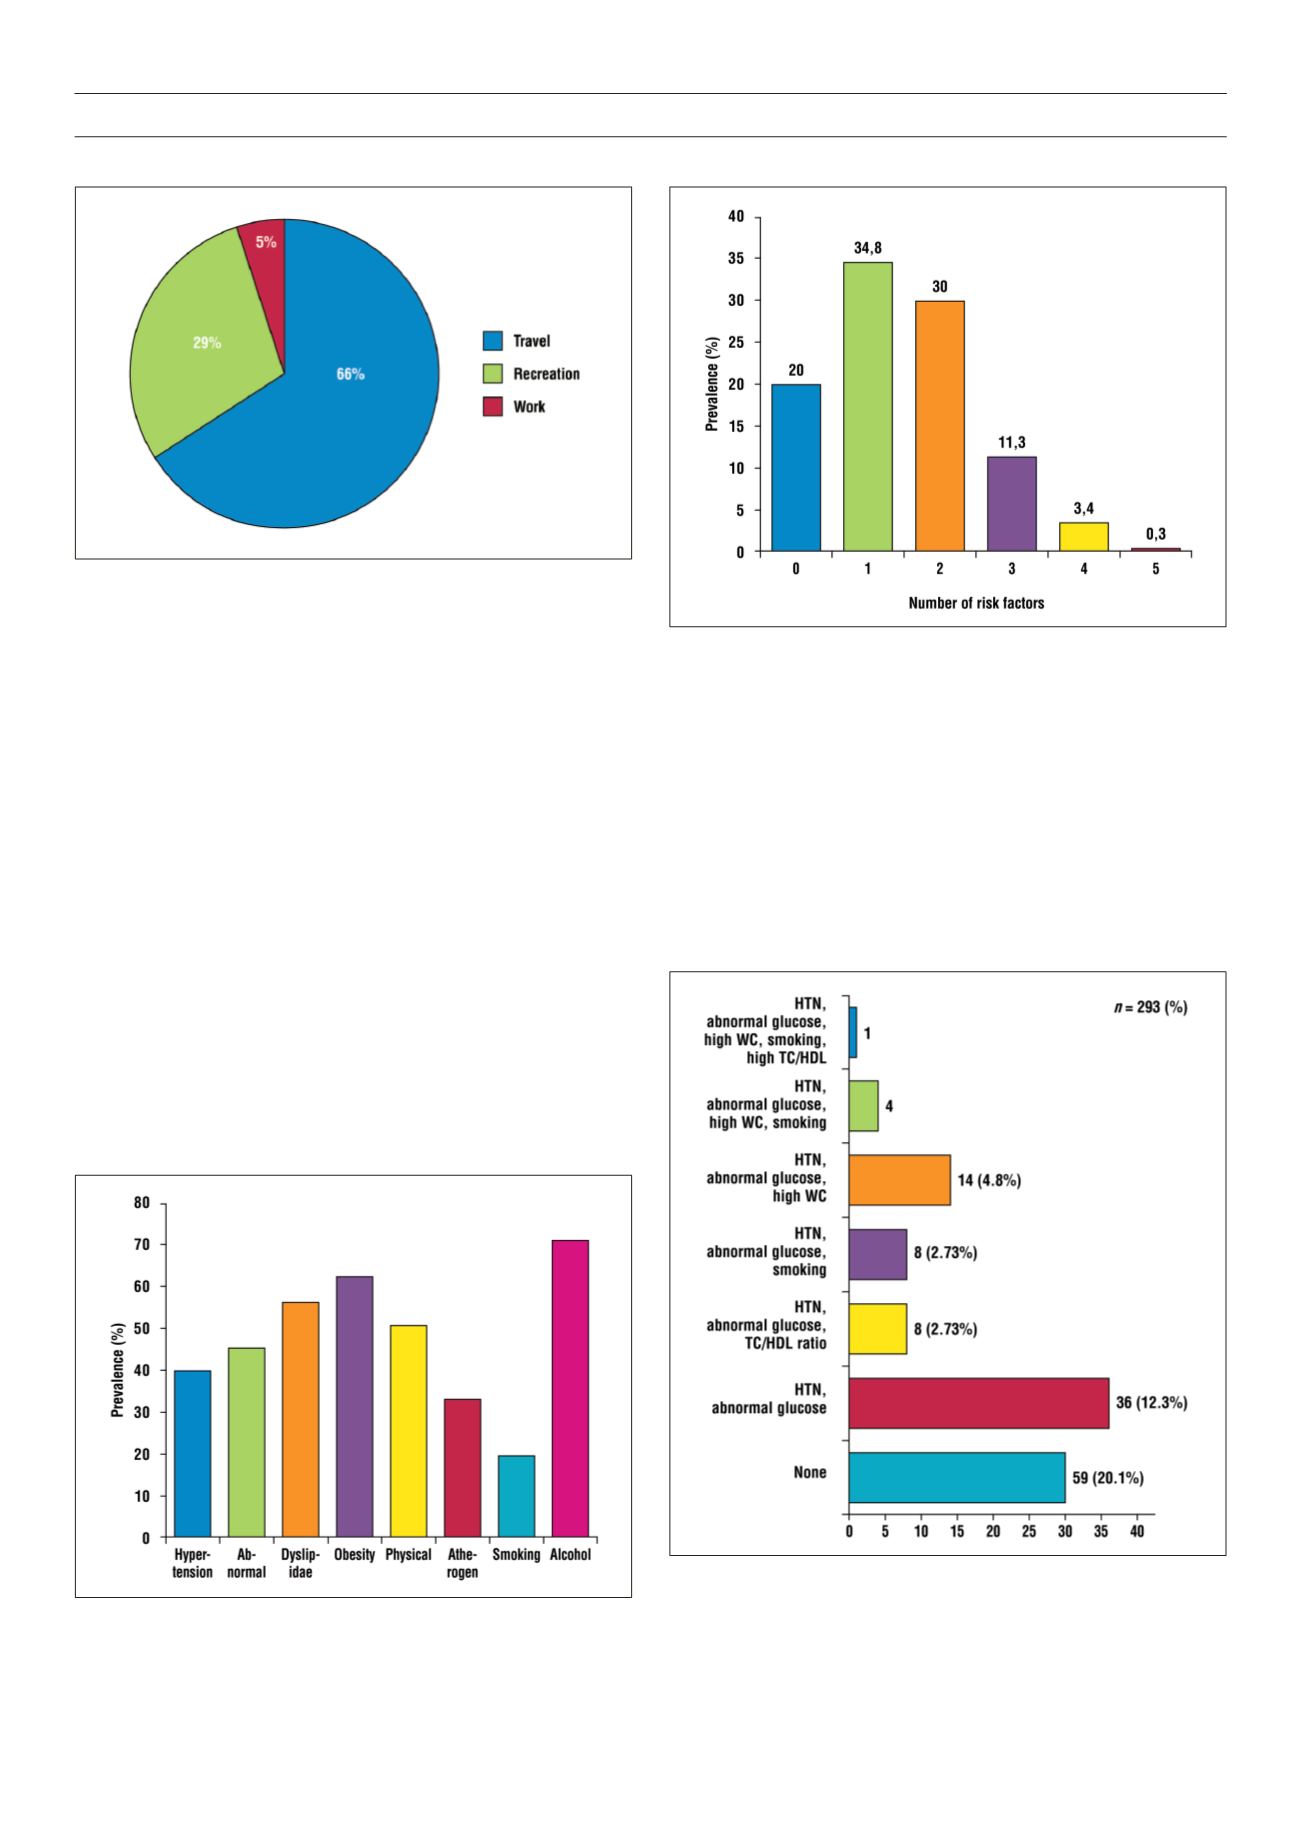
The mean METs/hour of the subjects was 638.8 ± 565.5, with
66% of them spending most of their time in the travel domain
(Fig. 3). The prevalence of physical inactivity in the study population,
defined as total METs/hour in all four domains < 600 per week
was 50.9% (95% CI: 53.1–64.3%). Two hundred and thirty-four
(80.4%) of the subjects were inactive, 56 (19.2%) were low active,
while one (0.3%) was medium active. None was highly active.
One hundred and thirty-two (45.1%) subjects had co-occurrence
of two or more risk factors. The most prevalent combination was the
duo of hypertension and abnormal glucose profile. Fig. 4 shows the
common single risk factors, while common risk factor combinations
are shown in Fig. 5. Alcohol use and physical inactivity were the
commonest behavioural risk factors, while overweight/obesity,
hypertension and dyslipidaemia were the three most common
metabolic risk factors in the subjects (Fig. 6).
Pearson’s correlation was used to determine how some
independent numerical variables (age, BMI, number of years of
professional driving and number of driving hours/week) correlated
with the major outcome variables (SBP, DBP and fasting blood
glucose level). Age correlated significantly with SBP (
r
= 0.362,
p
< 0.001) and DBP (
r
= 0.335,
p
< 0.001). BMI also correlated
significantly with SBP (
r
= 0.288,
p
< 0.001) and DBP (
r
= 0.208,
p
< 0.001). BMI alone correlated significantly with fasting glucose
(
r
= 0.136,
p
= 0.021).
Furthermore, the independent variables were dichotomised to
look for an association between them and outcome variables of
hypertension and abnormal glucose profile. In this model only age,
BMI, number of years of professional driving andwaist circumference
had significant associations with hypertension, while none of these
except BMI had a significant association with abnormal glucose
levels (Table 4).
Fig. 3.
Contributions of the GPAQ2 domains to total physical activity of the
subjects.
Fig. 4.
Prevalence of single risk factors among the subjects.
Fig. 5.
Prevalence of multiple risk factors among the subjects.
Fig. 6.
Prevalence of different combinations of risk factors in the subjects. HTN:
hypertension; WC: waist circumference; TC: total cholesterol; HDL: high-density
lipoprotein cholesterol.