
RESEARCH ARTICLE
SA JOURNAL OF DIABETES & VASCULAR DISEASE
78
VOLUME 16 NUMBER 2 • NOVEMBER 2019
patient developed major bleeding due to upper gastrointestinal
bleeding. Five patients developed minor bleeding in group A
(three patients developed access-site bleeding and two developed
haematuria). In group B, one patient developed major bleeding in
the lower gastrointestinal system and four developed haematuria.
Discussion
Diabetic patients usually have microangiopathy and microvascular
dysfunction. After restoration of normal blood flow in the coronary
arteries, there is still insufficient myocardial tissue reperfusion (i.e.
no reflow and slow flow) in up to 30% of patients.
19,20
Higher
incidence of re-infarction, heart failure, stroke and death was
previously documented in diabetic than in non-diabetic patients.
21
The main cause of slow flow and no reflow is thrombosis and
microvascular embolisation. These microvascular complications
are higher in AMI and primary PCI. Visible thrombus in coronary
angiography can be removed by a suction catheter, but it was
found that 61% of the thrombus was invisible in AMI.
22
Imperfect
inhibition of platelet aggregation during PCI may increase the
MACE. The use of adjuvant medical drugs such as GPIs considerably
decrease the incidence of distal embolisation and thrombotic
outcomes in STEMI patients.
23,24
This study demonstrated that IC tirofiban administered for
thrombotic complications or bail-out situations, in addition to
loading oral antiplatelets in diabetic patients, was associated with
Table 1.
Baseline characteristics of both groups
Group A (IV)
Group B (IC)
Parameters
(
n
= 50)
(
n
= 45)
t
/
χ
2
p
-value
Age (mean ± SD)
58.56 ± 10.18 55.90 ± 11.66
0.72
0.41
Gender,
n
(%)
Male
27 (54)
23 (51.1)
0.69
0.49
Female
23 (46)
22 (48.9)
Body mass index (kg/m
2
)
(mean + SD)
26.1 ± 6.5
25.4 ± 8.2
0.1
0.78
Smoking,
n
(%)
34 (68)
31 (68.8)
0.69
0.48
Hypertension,
n
(%)
20 (40)
19 (42)
0.08
0.78
Family history of coronary
artery disease,
n
(%)
9 (18)
7 (15.5)
0.61
0.54
Killip class > 1,
n
(%)
9 (18)
11 (24)
1.025 0.33
Aspirin,
n
(%)
49 (98)
43 (95.5)
0.05
0.87
Clopidogrel,
n
(%)
50 (100)
44 (97.7)
0.84
0.64
Beta-blockers,
n
(%)
41 (82)
39 (86.6)
0.06
0.85
ACEI or ARBs,
n
(%)
39 (78)
36 (80)
0.12
0.79
Statin,
n
(%)
44 (88)
39 (86.6)
0.15
0.73
Warfarin,
n
(%)
3 (6)
1 (2.2)
0.8
0.068
Onset-to-balloon time (min)
(mean ± SD)
167 ± 12.4
151 ± 18.3
5.8
0.089
Door-to-balloon time (min)
(mean ± SD)
46.8 ± 8.9
44 ± 7.6
1.72
0.38
Fasting glucose (mg/dl)
(mean ± SD)
168 ± 29.8
192 ± 46.6
3.64
0.074
Glycated haemoglobin
(HbA
1c
) (mean ± SD)
7.8 ± 2.2
9 ± 1.3
3.1
0.087
Creatinine (mg/dl)
(mean ± SD)
1.17 ± 0.41
1.08 ± 0.56
2.56
0.251
Low-density lipoprotein cholesterol
(mg/dl) (mean ± SD)
132.6 ± 46
147.09 ± 51
2.79
0.091
ACEI: angiotensin converting enzyme inhibitor; ARB: angiotensin II receptor
blocker.
Table 2.
Comparison between the groups regarding cardiac biomarkers
and left ventricular ejection fraction
Group A (IV) Group B (IC)
Parameters
(
n
= 50)
(
n
= 45)
t
p
-value
Peak CK-MB (U/l)
192.4 ± 86 155.68 ± 121 6.43 0.021*
Time to peak CK-MB (s)
12.9 ± 5.8
8.96 ± 3.2
11.4
0.001*
Peak hs-TnT (ng/dl)#
5342 ± 286
4291 ± 334
5.9
0.035*
Time to peak hs-TnT (s)
13.5 ± 3.1
9.24 ± 2.8
10.7
0.001*
50% ST-segment
resolution (%)
56
77
7.6
0.016*
LVEF at 48 hours (%)
38.6 ± 5.3
41.5 ± 3.2
0.84 0.632
LVEF at 30 days (%)
42.6 ± 4.2
48.2 ± 6.1
6.23 0.023*
Maximum C-reactive protein
level (ng/dl)
9.2 ± 2.3
5.7 ± 1.4
6.1
0.026*
#
Normal high-sensitivity troponin level up to 14 ng/dl.
CK-MB: creatine kinase-muscle/brain; hs-TnT: high-sensitivity troponin T;
LVEF: left ventricular ejection fraction.
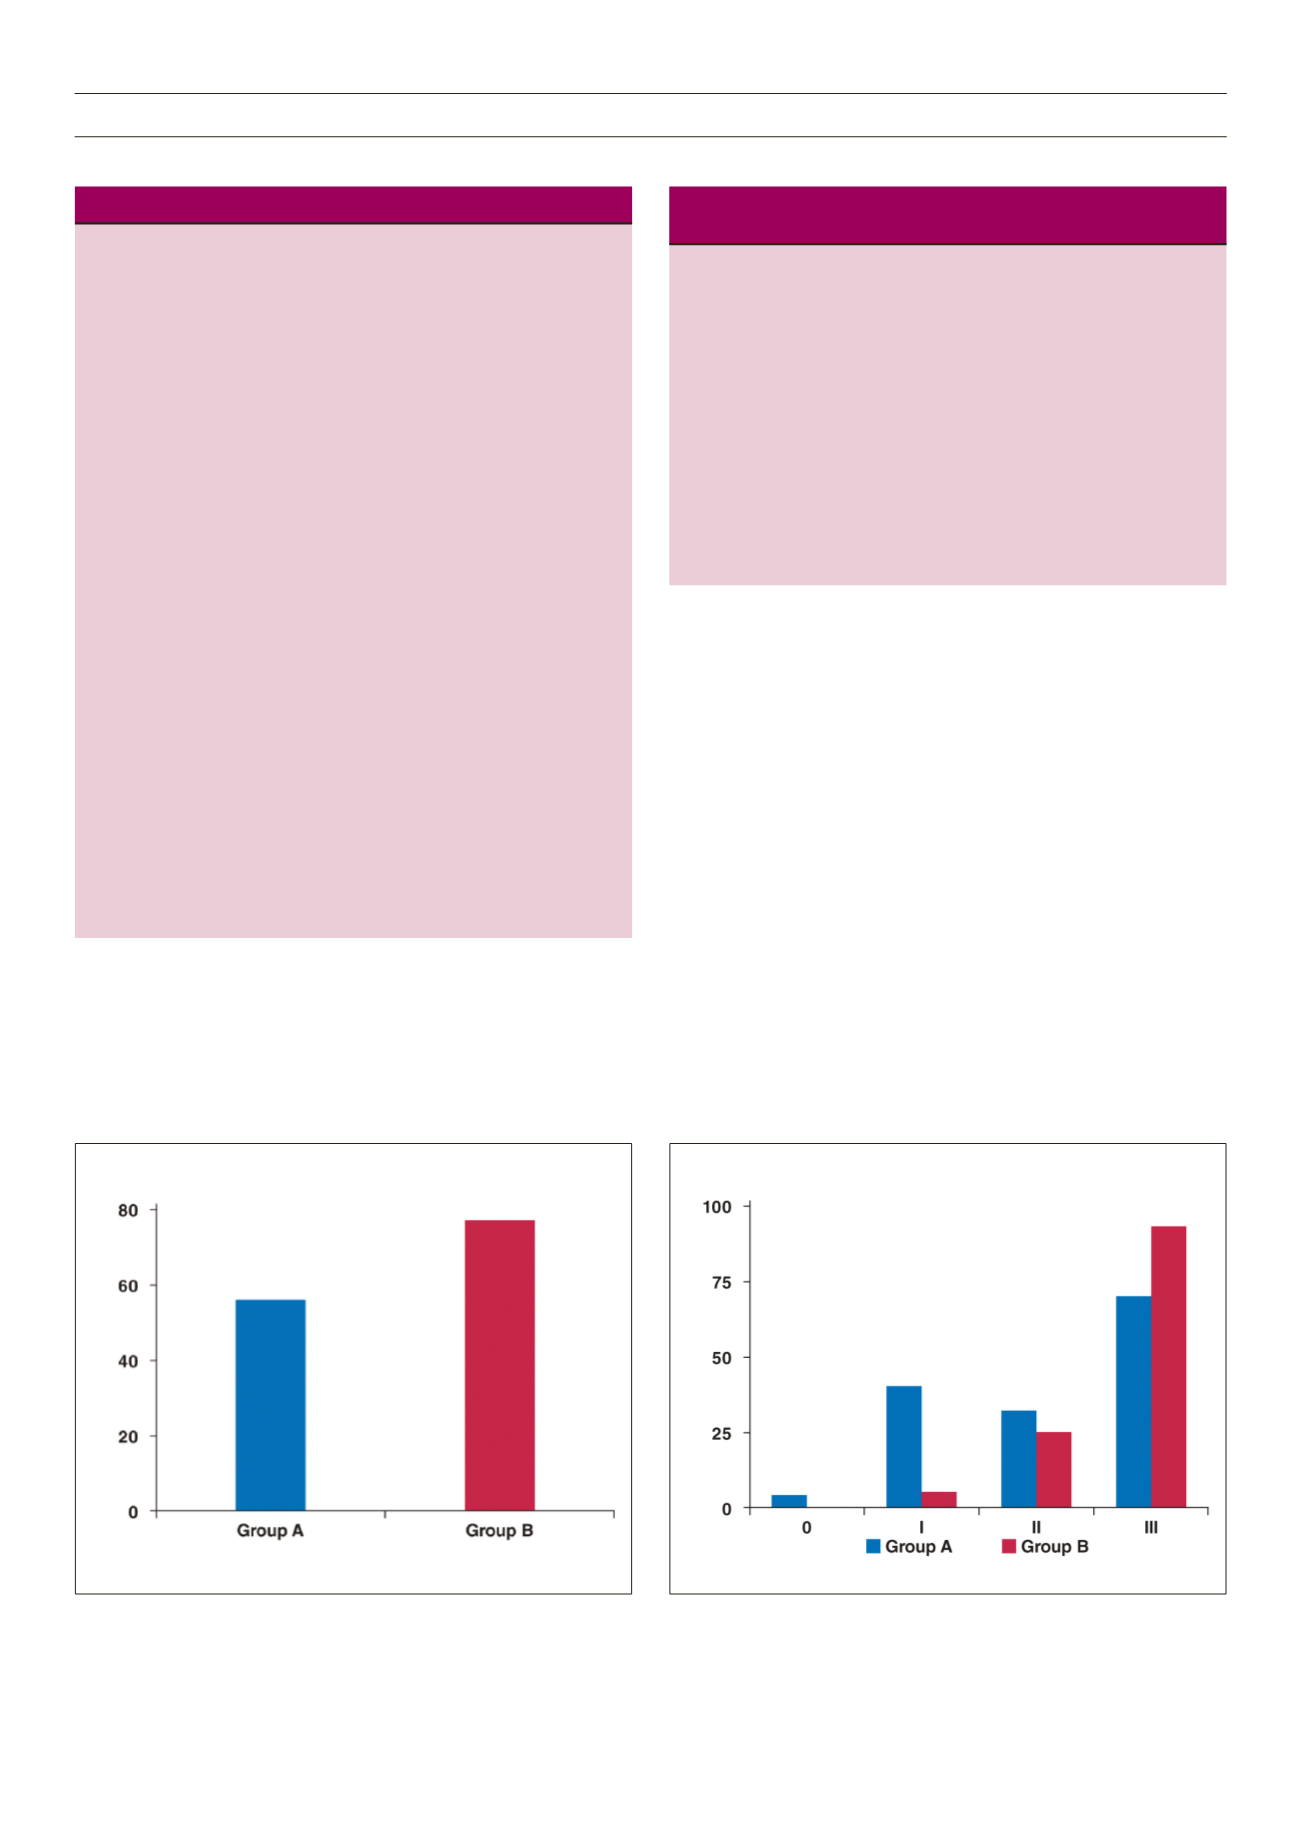
Fig. 1.
Frequency of 50% ST-segment resolution in the groups.
Fig. 2.
Comparison of TIMI flow post intervention in the groups.
Frequency
TIMI flow


