VOLUME 11 NUMBER 3 • SEPTEMBER 2014
123
SA JOURNAL OF DIABETES & VASCULAR DISEASE
REVIEW
Therefore, one of the major initial steps was to conduct
extensive validation studies of the Framingham and UKPDS CVD
risk models, using the unique features of the ADVANCE cohort.
3
These validation studies revealed that, in the cohort of ADVANCE
participants who had no known history of CVD at their enrolment
in the trial, the four-year absolute risk of cardiovascular events
and components was largely overestimated by the Framingham–
Anderson,
30
Framingham–D’Agostino
31
and UKPDS risk models.
9,19
This overestimation was also observed in men and women,
Caucasians and non-Caucasians, and the double-placebo cohort
(i.e. those assigned to the placebo group in the blood pressure-
lowering arm and the standard-care group of the blood glucose
control arm).
3
Discrimination of the Framingham and UKPDS risk models
in predicting CVD events in ADVANCE was poor for stroke, and
modest to acceptable for coronary heart disease and total CVD.
Recalibration substantially attenuated the magnitude of risk
overestimation by the Framingham and UKPDS risk models in
ADVANCE. Discrimination was unaffected as expected, indicating
the need for newCVD risk models with improved predictive accuracy
for people with diabetes, particularly those who are receiving many
contemporary cardiovascular riskreducing therapies.
Development of the ADVANCE cardiovascular risk
model
In developing a new model for risk prediction, it is critical to account
for the limitations of existing ones in order to improve performance.
The inclusion in ADVANCE of participants from many countries
provided the opportunity to account for the substantial variation
in the care of diabetes and CVD around the world. Available
models so far had been derived from homogenous populations.
The ADVANCE model targets total CVD and therefore captures the
interrelation between components of CVD such as CHD or stroke,
unlike many existing models that have focused specifically on these
components.
Thecomplexityoftherelationshipbetweenchronichyperglycaemia
and cardiovascular risk has been less fully addressed in existing
models. Some improvement was achieved in the ADVANCE model
through integration of risk factors to capture both the exposure to
chronic hyperglycaemia prior to and after the clinical diagnosis of
diabetes. Statistical method is an important component of model
development. Trusted statistical methods were used to select the
potential risk factors and test their suitability for inclusion in the
ADVANCE risk model.
14
Risk factors considered for inclusion in the ADVANCE model
were: age at clinical diagnosis of diabetes, duration of diagnosed
diabetes, gender, blood pressure (BP) indices [systolic BP, diastolic
BP, mean arterial (MAP) and pulse (PP) pressures], lipid variables
[total, high-density lipoprotein (HDL) and non-HDL cholesterol, ratio
of total:HDL cholesterol and triglycerides], body mass index (BMI),
waist circumference, waist-to-hip ratio, BP-lowering medication
(i.e. treated hypertension), statin use, current smoking, retinopathy,
atrial fibrillation (past or present), urinary albumin:creatinine ratio
(ACR), serum creatinine (Scr), HbA
1c
and fasting blood glucose
levels, and randomised treatments (BP lowering and glucose control
regimens).
Ten of these candidate risk factors were included in the final
ADVANCE risk model. Age at diabetes diagnosis and known
duration of diabetes were preferred to age at baseline to improve
the applicability of the ADVANCE risk model to other populations.
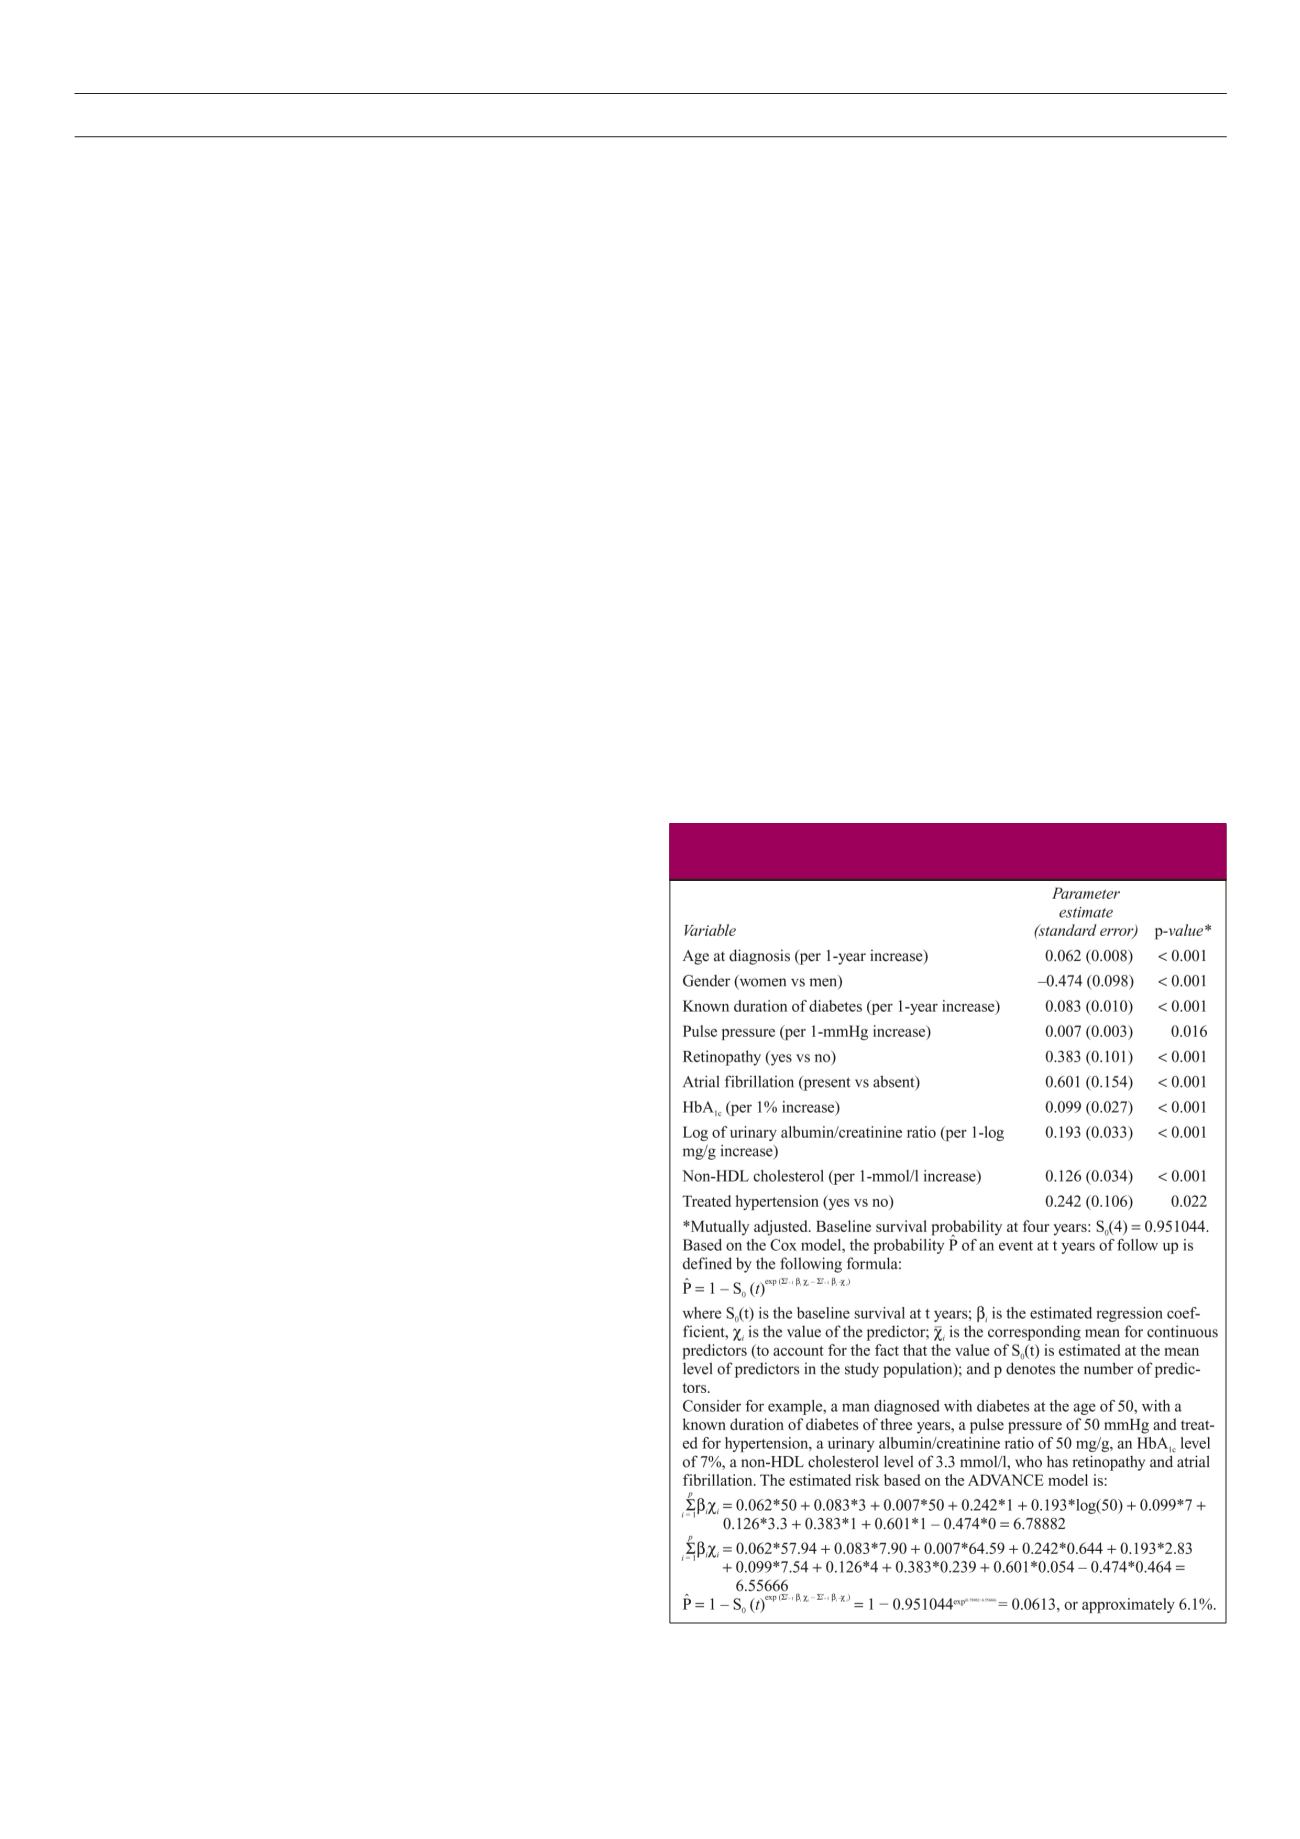
The beta coefficients and accompanying standard error for risk
factors in the ADVANCE risk model are shown in Table 1.
14
Performance of the ADVANCE risk model
The applicability of the ADVANCE risk model
14
was tested on the
same population used to develop the model (i.e. internal validation)
and on an independent external sample for which the DIAB-
HYCAR cohort
32
was used. In both internal and external validations,
the discrimination of the ADVANCE model was acceptable. In
comparison with existing total CVD models, the ADVANCE model
largely outperformed the Framingham–Anderson and Framingham
D’Agostino models. The calibration of the ADVANCE model was
excellent in internal validation and good in external validation, with
only a modest risk underestimation. This is likely explained by the
difference in the levels of preventive therapies between ADVANCE
and DIABHYCAR population.
Interestingly, the agreement between predictions by the
ADVANCE models and the observed CVD events was consistent
across different cut-off points or predicted risk for CVD. For
comparison, the two Framingham equations overestimated the risk
of CVD in the DIAB-HYCAR cohort by 65% (Anderson equation)
and 99% (D’Agostino equation). Using a cut-off point for four-
year predicted risk of ≥ 8% (which is approximately equivalent to
a 10-year predicted risk of 20% and above), the ADVANCE model
Table 1.
BETA coefficients (95% confidence interval) and standard
errors for predictors in the advance CVD prediction model
14


