128
VOLUME 11 NUMBER 3 • SEPTEMBER 2014
RESEARCH ARTICLE
SA JOURNAL OF DIABETES & VASCULAR DISEASE
of diabetes, treatment and complications, and cardiovascular risk
profile (Table 1).
With few exceptions, participants’ characteristics were mostly
similar across the participating centres. The few exceptions related
to hip circumference (
p
< 0.001), diastolic blood pressure (
p
<
0.001), haemoglobin A
1c
level (
p
< 0.001), creatinine clearance rate
(
p
= 0.04), the use of ACE inhibitors (
p
= 0.01) and the presence of
neuropathy (
p
= 0.008).
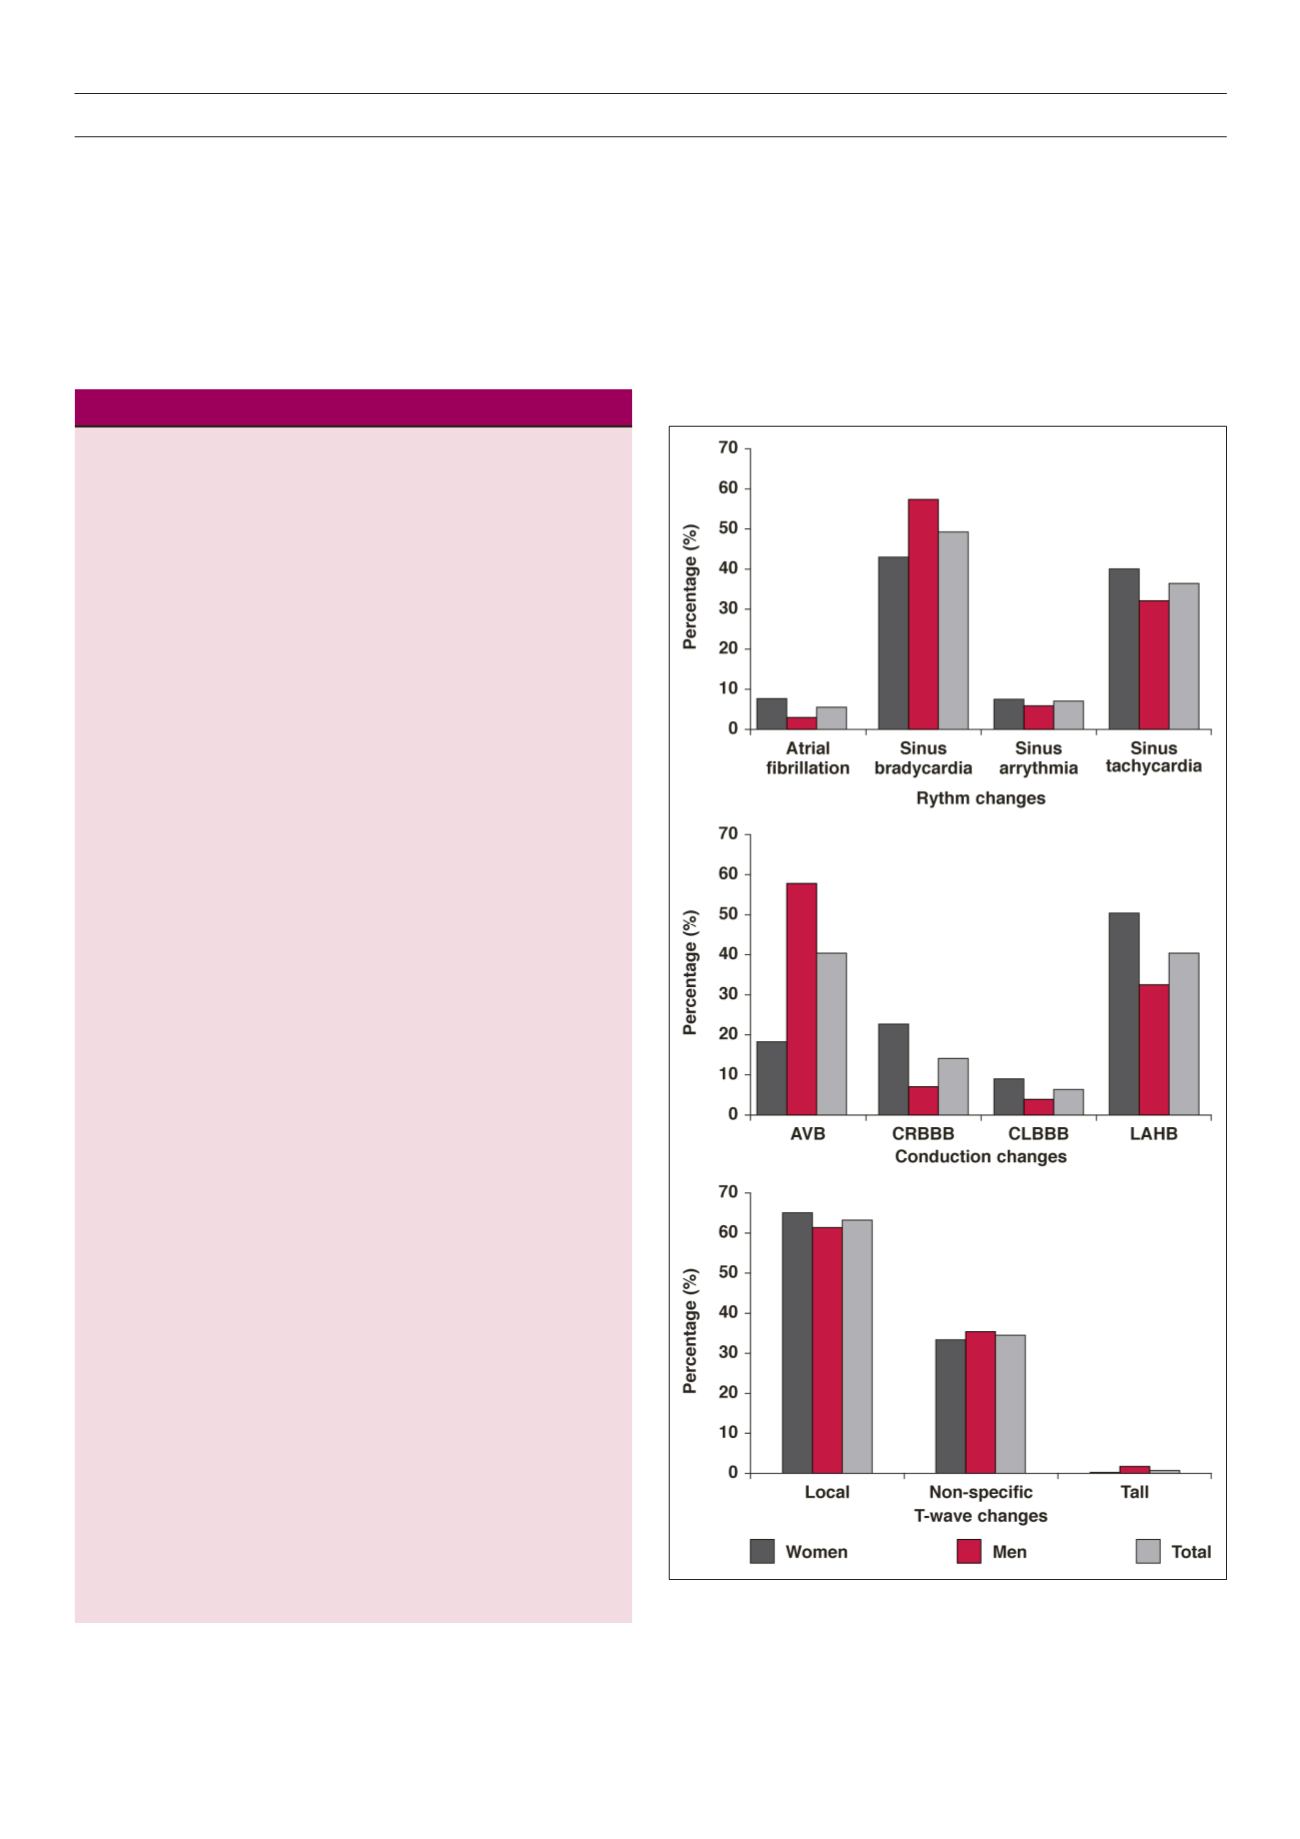
The distribution of ECG abnormalities was: T-wave aberrations
(20.9%), left ventricular hypertrophy according to the Cornell
product criteria (16.4%), arrhythmia (16.2%), ischaemic heart
disease (13.6%), conduction defects (11.9%), QTc prolongation
(10.2%) and ectopic beats (4.8%). Unlike T-wave aberrations and
left ventricular hypertrophy, the prevalence of major aberrations was
similar in men and women (Table 2). The distribution of subtypes
of arrhythmia, conduction defects and T-wave aberrations is shown
in Fig. 1.
Table 1.
Profile of the 420 men and women with type 2 diabetes
Men Women Total
Variables
n
(%)
n
(%)
p
n
(%)
Number (%)
207 (49)
213 (51)
56.7 (9.92)
Age (years)
55.9 (9.83) 57.5 (9.96)
0.09
4 (1–9)
Median (range) known
4 (0–9)
4 (1–8)
0.71
213 (50.7)
duration of diabetes (years)
Parental history of diabetes
103 (49.7) 110 (51.6)
0.69
32 (7.6)
Smoking
27 (13.1)
5 (2.3)
< 0.001 28.5 (5.2)
Body mass index (kg/m
2
)
27.2 (4)
29.7 (6)
< 0.001 95.1 (11.9)
Waist circumference (cm)
95.3 (10.8) 94.9 (12.92) 0.71 101.2 (11.8)
Hip circumference (cm)
98.5 (10) 103.7 (12.9) < 0.001 0.94 (0.10)
Waist-to-hip ratio
0.96 (0.08) 0.91 (0.11) < 0.001 142.2 (25.3)
Hypertension and treatments
Systolic blood pressure
142.8 (23.6) 141.6 (26.91) 0.61
85.1 (13.2)
(mmHg)
Diastolic blood pressure 85.6 (12.2) 84.5 (14.15)
0.37 57.1 (18.2)
(mmHg)
Pulse pressure (mmHg)
57.2 (16.8) 57.1 (19.49) 0.95
211 (50.2)
Hypertension
97 (46.8) 114 (53.5%) 0.17
186 (44.3)
Any blood pressurelowering 83 (40.1) 103 (48.4)
0.09
139 (33.1)
medication
ACE inhibitors
70 (33.8) 69 (32.4)
0.84
5 (1.2)
ARA II antagonists
2 (1)
3 (1.4)
0.99
118 (28.1)
Diuretics
54 (26.1)
64 (30)
0.37
69 (16.4)
Calcium channel blockers
33 (15.9) 36 (16.9)
0.79
30 (7.1)
Beta-blockers
7 (3.4)
23 (10.8)
0.004
185 (49)
Lipid profile and lipid-modifying therapies
Total cholesterol (mg/dl)
187 (49)
184 (51)
0.57
47 (18)
HDL cholesterol (mg/dl)
47 (19)
48 (18)
0.52 101 (67–141)
Median (range) triglycerides 99 (64–142) 102 (68–140) 0.62
35 (13.2)
(mg/dl)
Lipid modifying therapies
19 (9.2)
16 (7.5)
0.58
1 (0.2)
History of cardiovascular disease
Coronary heart disease
0 (0.0)
1 (0.5%)
0.32
15 (3.6)
Cerebrovascular diseases
6 (2.9)
9 (4.2%)
0.46
6 (1.4)
Lower limb occlusive
3 (1.4)
3 (1.4%)
0.97 89 (67–111)
vascular disease
Median (range) creatinine 91 (70–113) 88(63–108)
0.23
273 (66)
clearance (ml/min/1.73 m
2
)
Diabetes treatment and control
Metformin
133 (64.7) 143 (67%)
0.58
185 (44)
Suphonamide
93 (45)
92 (43%)
0.69
9 (2.1)
Acarbose
2 (0.9)
7 (3.3%)
0.19
68 (16.2)
Insulin
37 (17.9) 31 (14.5%)
0.34
177 (81)
Fasting capillary glucose
185 (85)
169 (77)
0.04
8.2 (2.3)
(mg/dl)
Haemoglobin A
1c
(%)
8.5 (2.3)
7.9 (2.2)
0.03
Microvascular complications
Any diabetic retinopathy
38 (18.3%) 28 (13.1)
0.14
66 (15.7)
Any diabetic nephropathy 30 (14.5%) 37 (17.4)
0.42
67 (15.9)
Any diabetic neuropathy
52 (25.1%) 42 (19.7)
0.18
94 (22.4)
Fig. 1.
Rhythm, conduction and T-wave changes in 420 men and women with
type 2 diabetes.


