124
VOLUME 11 NUMBER 3 • SEPTEMBER 2014
REVIEW
SA JOURNAL OF DIABETES & VASCULAR DISEASE
would reliably identify 22% of the ADVANCE participants and 39%
of the DIAB-HYCAR participants in whom 48% and 66% of CVD
events, respectively, occurred during follow up. Further intensifying
treatment in such groups on top of any baseline therapy could
achieve significant gain in terms of CVD risk reduction.
Dissemination of the ADVANCE risk model
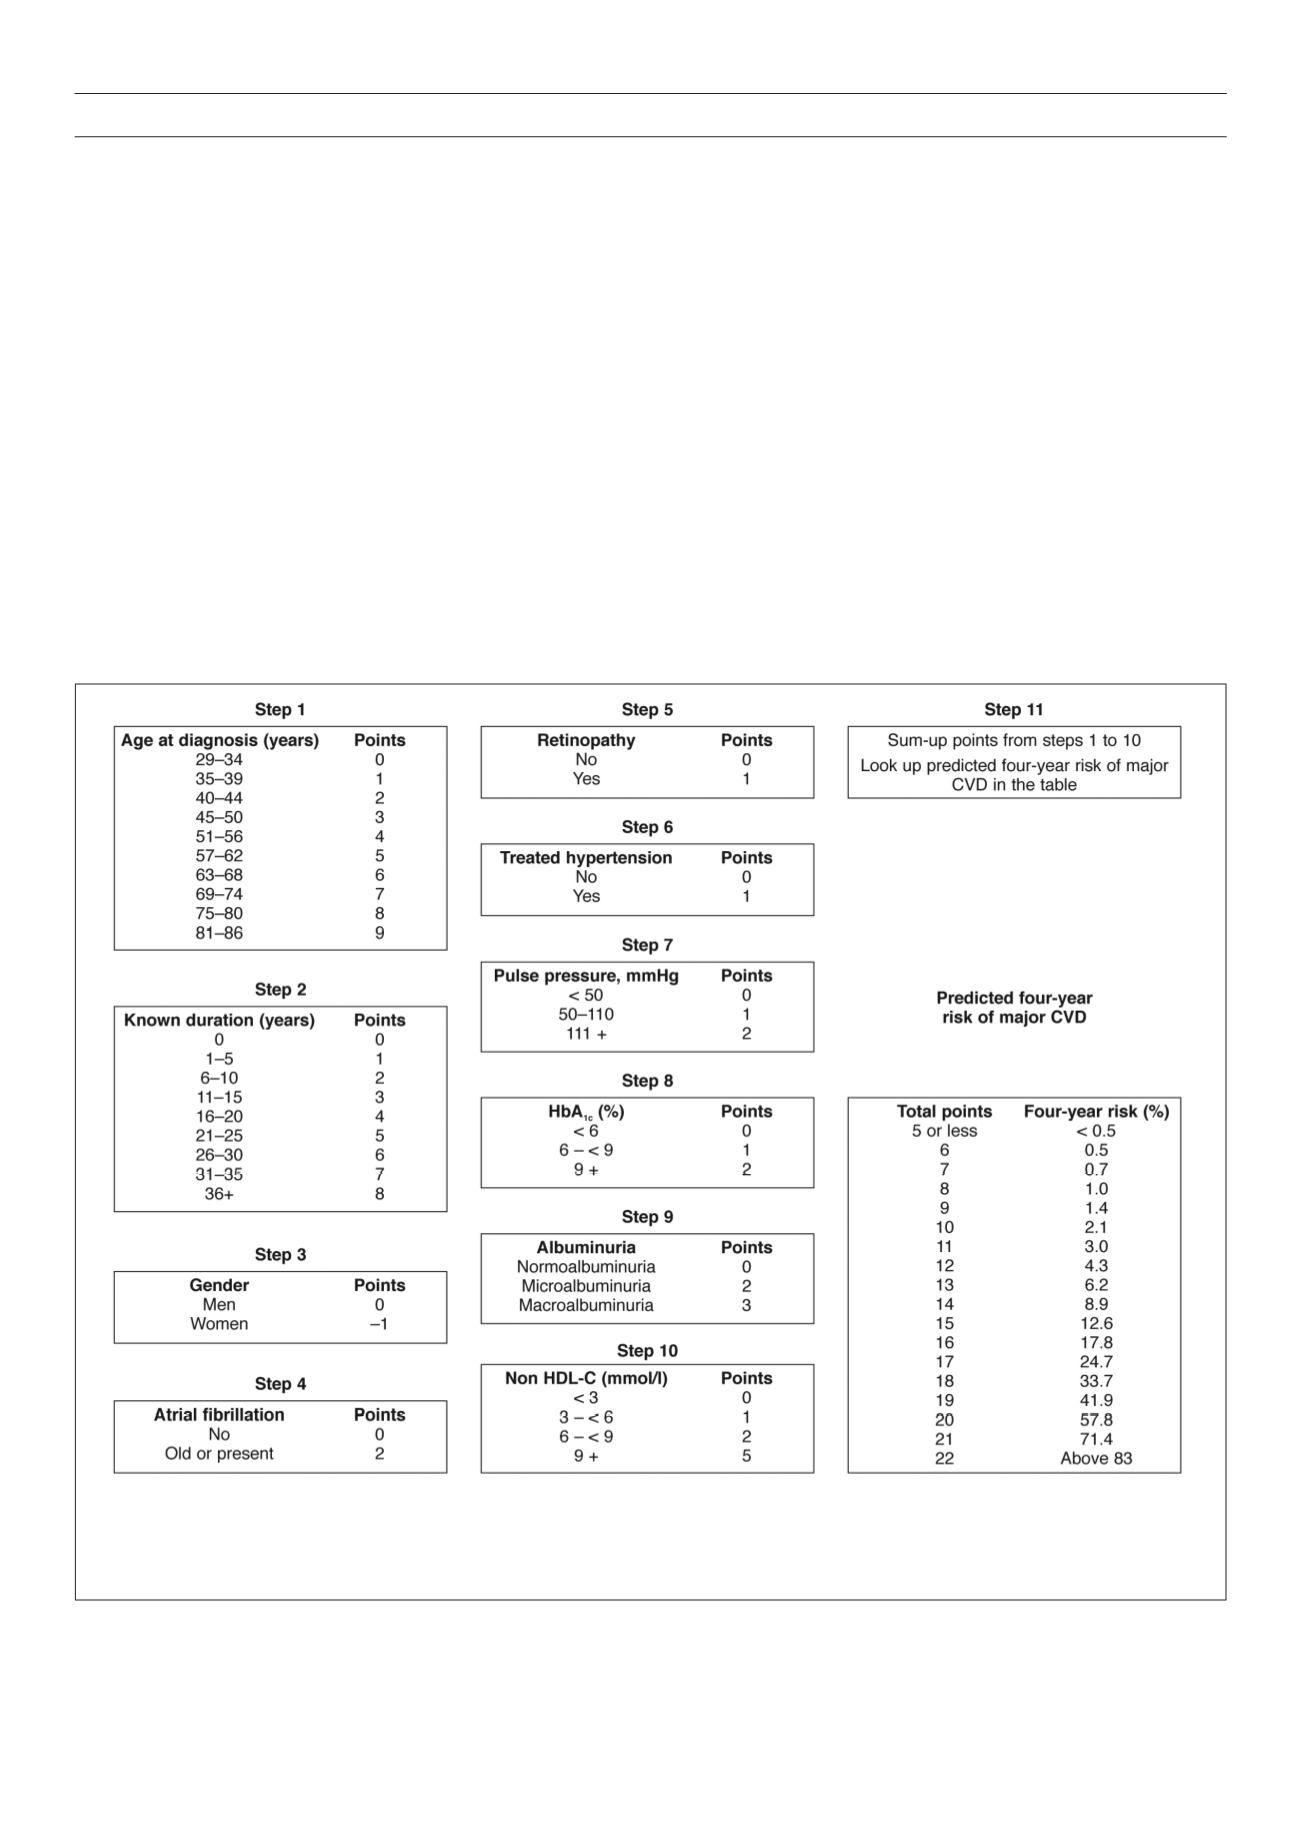
To facilitate the uptake of the ADVANCE model in clinical practice,
a hand-held calculator and a risk-scoring chart (Fig. 1) have been
developed.
14
Other tools from this model, including an online
calculator, are available on the website of the model to improve
its uptake.
33
Extensive validations have been conducted to assure
that these tools provide estimates similar to those from the full
ADVANCE risk equation.
Performance of existing global risk tools for
cardiovascular risk estimation in diabetics
Two systematic reviews have examined the performance of CVD
risk-evaluation models applicable to people with diabetes.
7,34
The
most recent and comprehensive review identified 45 CVD risk
models applicable to people with diabetes.
7
Of these, 12 were
specifically developed for people with type 2 diabetes (including
the ADVANCE model) and 33 were developed in the general
population, accounting for diabetes as a risk factor. These models
vary greatly in their quality and the methodology used to develop
them.
Only about a third of the existing CVD risk tools applicable to
people with diabetes have been externally validated in a population
with diabetes. The discriminative ability of both diabetes-specific
CVD prediction models and general population prediction models
that use diabetes status as a predictor was generally acceptable to
good (i.e. C-statistic ≥ 0.70). The discrimination of prediction models
designed for the general population was moderate (C-statistic:
0.59–0.80) and their calibration generally poor.
The most commonly validated models were the general
population-based Framingham cardiovascular risk equations
and the diabetes-specific UKPDS risk engines. The Framingham
prediction models also showed a low-to-acceptable discrimination
and a poor calibration. Although the discriminative power of
As an illustration of the use of the risk-scoring chart, a male subject, diagnosed with diabetes three years previously at the age of 50 years, who has a pulse
pressure of 50 mmHg and is currently treated for hypertension, also has retinopathy, atrial fibrillation and microalbuminuria, an HbA
1c
level of 7% and a non-
HDL cholesterol level of 3.3 mmol/l, will receive a total score of 13 points: 0 for gender, 3 for age at diagnosis, 1 for known duration, 1 for pulse pressure, 1 for
treated hypertension, 1 for retinopathy, 2 for atrial fibrillation, 2 for microabuminuria, and 1 for HbA
1c
and non-HDL cholesterol level each. A score of 13 points
is equivalent to a four-year estimated risk of 6.2%, which is similar to the risk estimated for the same patient using the full equation.
Fig. 1.
Major cardiovascular disease points and four-year predicted risk by the ADVANCE model equation.
14


