


 27 / 48

VOLUME 12 NUMBER 1 • JULY 2015
25
SA JOURNAL OF DIABETES & VASCULAR DISEASE
RESEARCH ARTICLE
displayed off-target LDL-C levels (≥ 1.8 mmol/l and a decrease in
LDL-C levels of < 50%), 39.7% showed low HDL-C levels, and
54.2% had elevated TG levels. In comparison, patients in the CVD
without DM group showed a higher rate of LDL-C not at target
(68.0%), decreased rates of low HDL-C (33.8%), and elevated TG
levels (38.2%). Interestingly, the ESC SCORE group with risk of ≥
10% showed a lower proportion of patients with low HDL-C and
elevated TG levels. Overall, we found that LDL-C not at goal was
the most common lipid abnormality observed in each of the four
sub-sets.
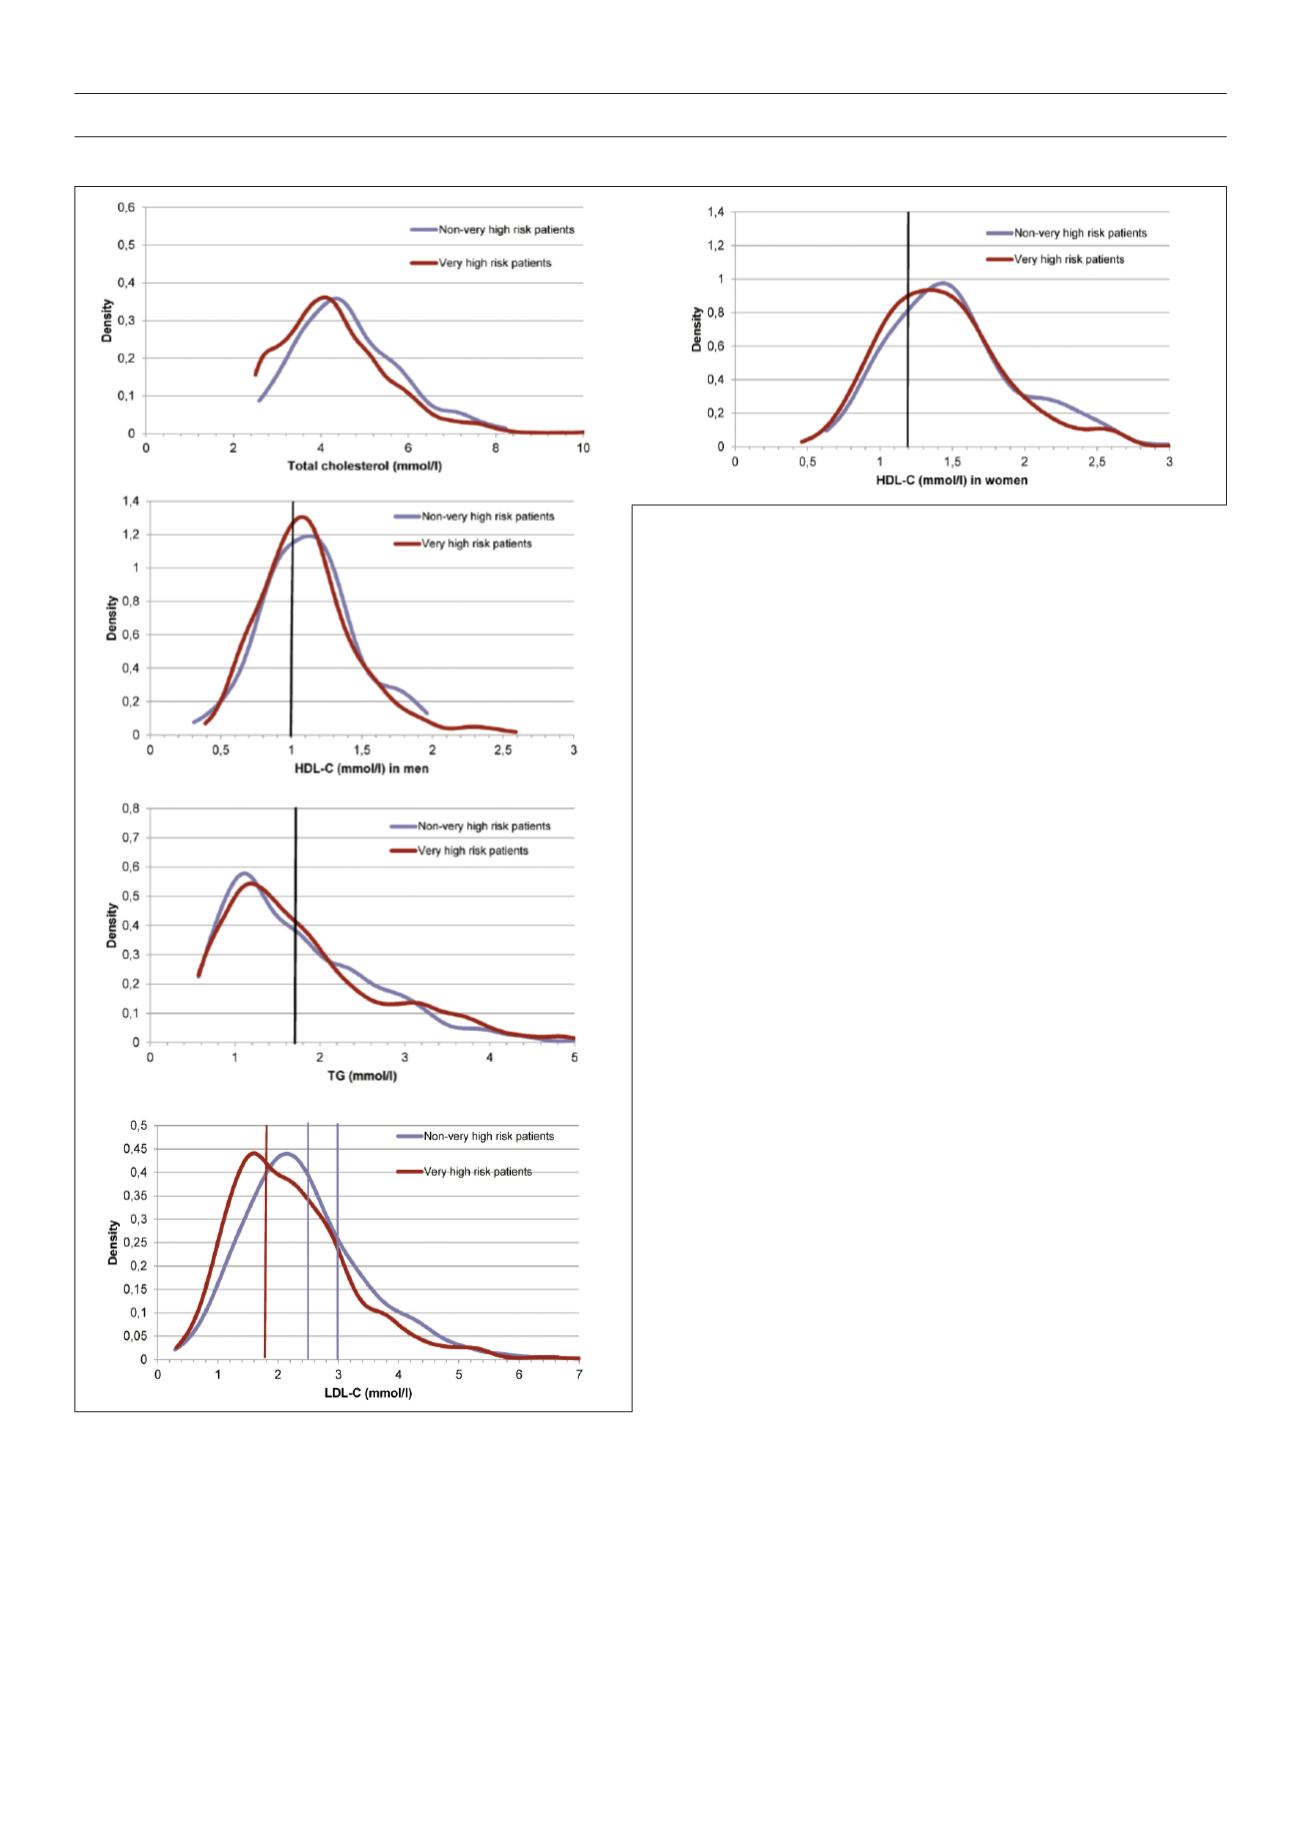
Additionally, we analysed patient lipid abnormalities using
kernel density curves for the empirical distributions of very high-
risk and non-very high-risk patient groups with regard to total
cholesterol, LDL-C, HDL-C (separately for men and women), and
TG levels (ESC guidelines indicated as superimposed vertical lines)
(Fig. 2). Overall, we found that the density curves were unimodal
and positively skewed, and the data indicated that the very high-
risk group showed slightly lower overall LDL-C levels than non-very
high-risk patients. Moreover, we observed that women maintained
higher overall HDL-C levels than men in both the very high and
non-very high-risk groups, while TG levels were similar between
the two risk groups.
Distributions of lipid abnormalities
Distributions of single and multiple combined lipid abnormalities
for our study are shown in Figs 3–5. Here, we present the joint
distribution of lipid abnormalities for the entire sample and then
for sub-samples of very high-risk and non-very high-risk patients.
Additionally, joint distributions that either include or exclude
patients with no lipid abnormalities are provided for each patient
group.
Fig. 3 shows that in 39.4% of patients with a total lipid profile,
there was only one single-lipid abnormality, 32.8% had two
abnormalities, and the remaining 7.3% had abnormalities in all
three assessed components of the lipid profile. Among statin-
treated patients, the most common abnormality was high LDL-C
levels (18.8% of all cases), accounting for 47.7% of all single-
lipid abnormalities. Among the 983 patients, 20.4% had no lipid
abnormalities.
Figs 4 and 5 present the joint distribution for non-very high-
risk and very high-risk patients, respectively, and indicate different
patterns of prevalence for these sub-groups. For the 261 non-
very high-risk patients with at least one abnormality depicted in
Fig. 4, 37.2% had only one lipid abnormality, 21.5% had two
lipid abnormalities and the remaining 4.2% had all three lipid
abnormalities.
Fig. 2.
Kernel density curves of lipids. Density curves were unimodal and posi-
tively skewed throughout. The data indicate that the very high-risk group (red
line, upper right panel) showed slightly lower overall LDL-C levels than non-very
high-risk patients (blue line). Moreover, we observed that women (right panel in
the middle) maintained higher overall HDL-C levels than men (left panel in the
middle) in both the very-high and non-very high-risk groups, while triglyceride
levels were similar between the two risk groups (lower panel). Density curves for
total cholesterol were mostly overlapping (upper left panel). Vertical lines mark
the cut-off point of ESC guidelines (2011); LDL-C, low-density lipoprotein choles-
terol; HDL-C, high-density lipoprotein cholesterol; TG, triglycerides.