


 25 / 48

SA JOURNAL OF DIABETES & VASCULAR DISEASE
RESEARCH ARTICLE
VOLUME 14 NUMBER 2 • DECEMBER 2017
63
Results
The study group was divided into two, according to angiographic
results (CAD negative and CAD positive). There were no significant
differences between the two groups with regard to age, gender,
hypertension, hyperlipidaemia, smoking, BMI, systolic and
diastolic blood pressure, and medications, including aspirin, renin–
angiotensin system (RAS) blockers and statins (Table 1).
Clopidogrel and calcium channel blocker use was higher in the
CAD-positive group (
p
< 0.001 and
p
= 0.001, respectively) (Table
1). There were no differences between the two groups in serum
levels of glucose, creatinine, uric acid, hs-CRP, lipid profile, WBC,
haemoglobin, MPV and N/L ratio (Table 1). RDW was significantly
higher in the CAD-positive group (12.5 ± 1.5 vs 13.8 ± 1.7%,
p
<
0.001) (Table 1).
The most appropriate cut-off point calculated for predicting CAD
was 13.25%. The patients who had a RDW ≤ 13.25%were included
in the low RDW group. The rest formed the high RDW group.
There were no significant differences between the low and
high RDW groups with regard to age, gender, hypertension,
hyperlipidaemia, smoking, BMI, systolic and diastolic blood pressure
and medications (Table 2). There were also no differences between
the low and high RDW groups with regard to serum levels of
glucose, uric acid, lipid profile, WBC and haemoglobin (Table 2).
Serum levels of creatinine, hs-CRP, MPV and N/L ratio were
significantly higher in the high RDW group (
p
< 0.005 for all) (Table
2). RDW was positively correlated with hs-CRP, MPV and N/L ratio
(
r
= 0.248,
r
= 0.240 and
r
= 0.281, respectively and
p
= 0.033 for
hs-CRP,
p
< 0.001 for MPV and N/L ratio).
Patients with CAD who had a RDW value above the cut-off point
also had higher Gensini scores, higher percentages of obstructive
CAD and triple-vessel disease (
p
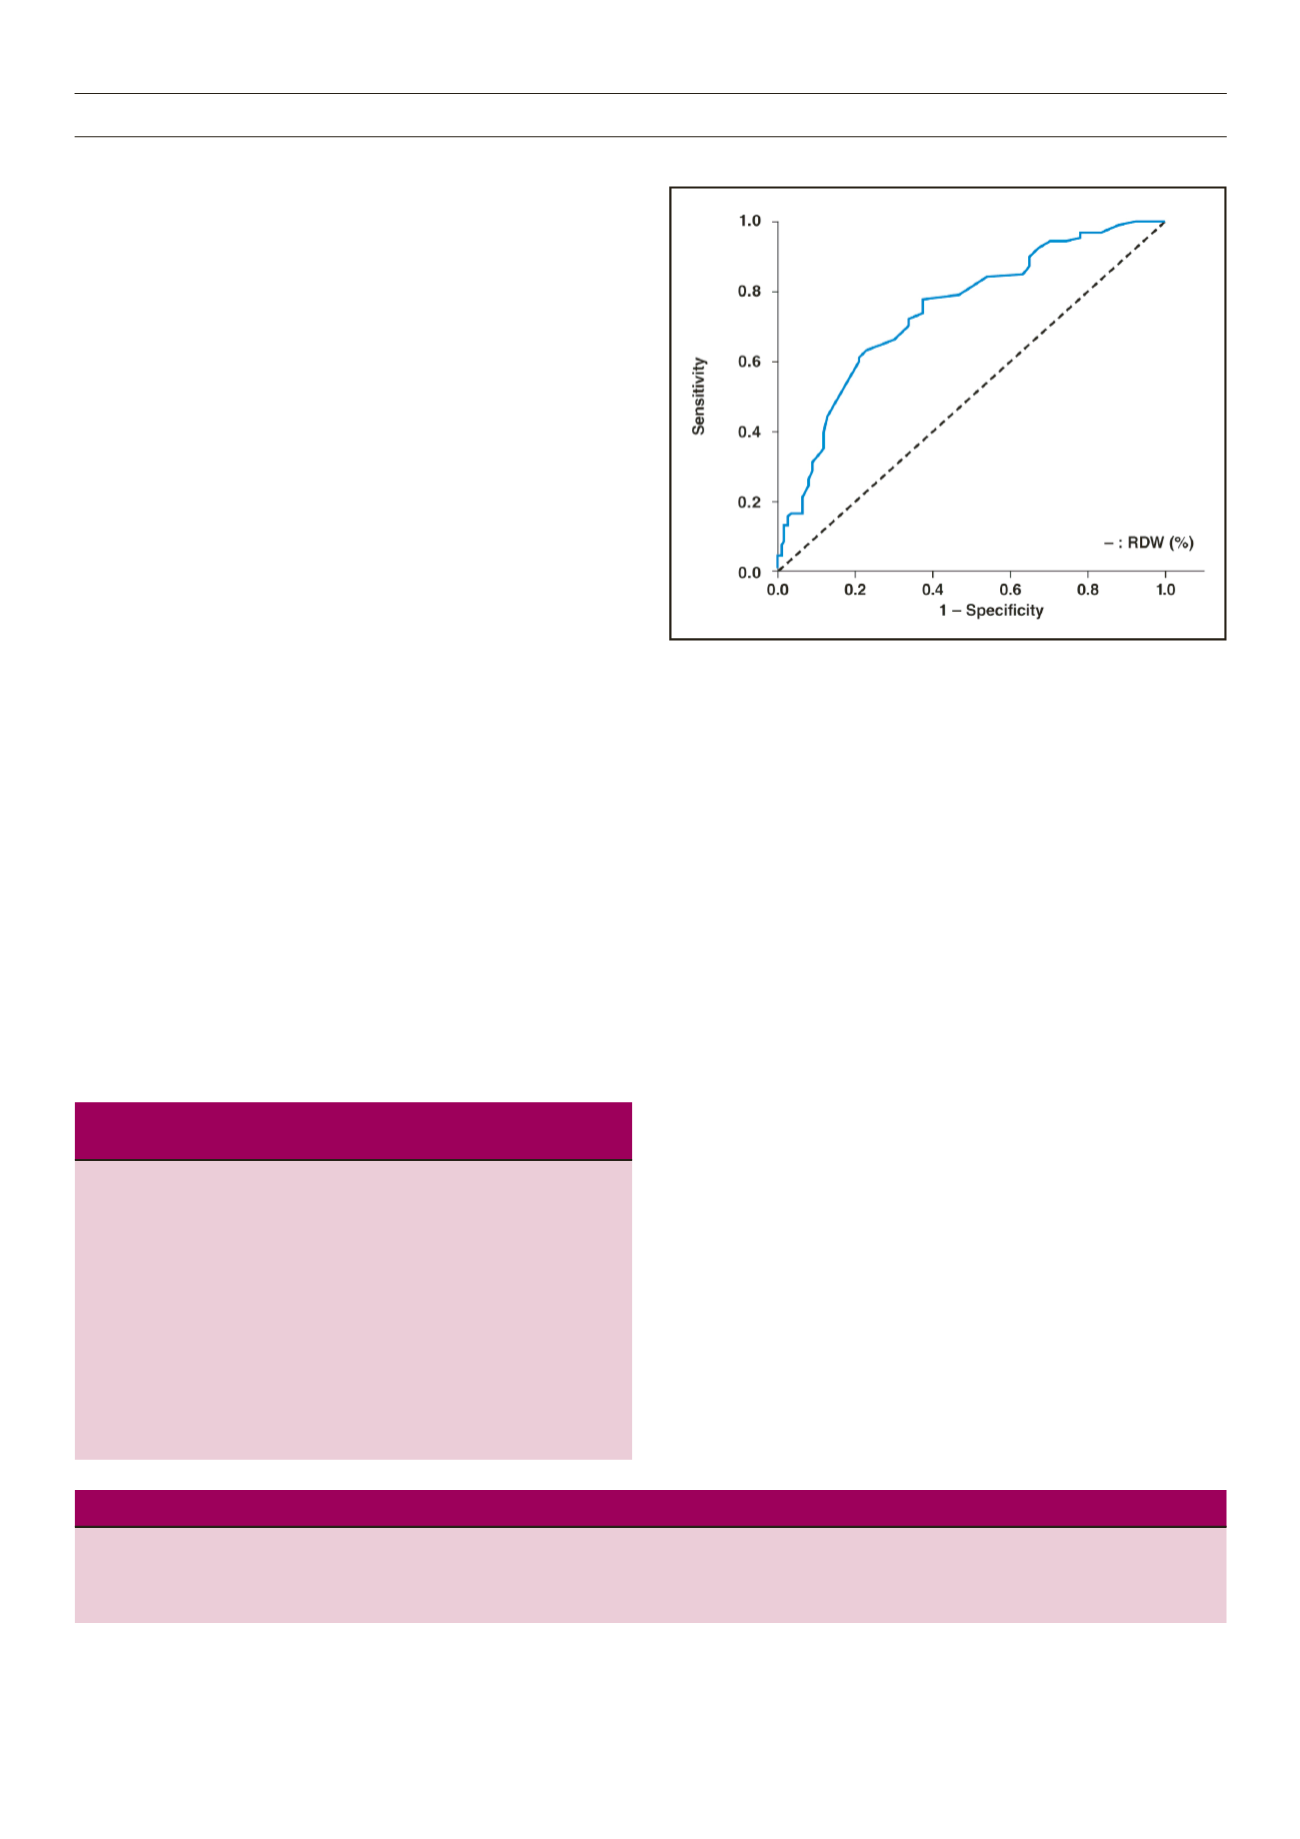
≤ 0.001 for all) (Table 3). According
to the cut-off values calculated using ROC curve analysis, RDW >
13.25% had a high diagnostic accuracy for predicting CAD (area
under the ROC curve = 0.742,
p
< 0.001) (Table 4, Fig. 1). RDW
was positively correlated with Gensini score, obstructive CAD and
triple-vessel disease (
r
= 0.468,
r
= 0.409 and
r
= 0.332, respectively
and
p
< 0.001 for all).
Discussion
This study showed an association between RDWand CAD in diabetic
patients. RDW values were found to be higher in the diabetic CAD
population and higher RDW values were related to more extensive
and complex coronary lesions.
RDW is a marker of the variation in size of red blood cells
circulating in the body, which reflects the value of anisocytosis.
1
It
is routinely reported during automated complete blood counts. An
elevation in RDW values may be seen in patients with ineffective
erythropoiesis (iron, vitamin B
12
or folic acid deficiency and various
haemoglobinopathies), recent blood transfusions and haemolysis.
15
In daily practice it is commonly used to narrow the differential
diagnosis of anaemia.
2
The growing attention given to the relationship between
RDW and cardiovascular events was first spurred on by the report
from Felker
et al
., which concluded that there was a strong and
independent association between RDW and the risk of adverse
outcomes in heart failure patients.
16
Subsequently, Tonelli
et al
.
predicted an independent relationship between RDW and the risk
of cardiovascular death in patients with CAD.
3,16
Following the
direction of these studies, researchers reported that higher RDW
values were also associated with a worse prognosis in peripheral
artery disease and even in the unselected population.
5,6
Several explanations could be postulated in order to explain the
underlying mechanisms that may contribute to a worse prognosis
among patients with cardiovascular disease. However the reason
for the poor prognosis remains unclear.
It has not been determined yet whether RDW is a marker of
the severity of various disorders or if there is direct link between
Table 4.
Diagnostic accuracy of red cell distribution width for coronary artery disease
Variable
Cut-off value
AUC
95% CI of AUC
Sensitivity
Specificity
p
-value
a
RDW (%)
> 13.25
0.742
0.679–0.806
0.629
0.771
< 0.001
AUC: area under the receiver operating characteristic curve, CI: confidence interval, RDW: red cell distribution width. aSignificance level of AUC.
Table 2.
Baseline characteristics and laboratory findings of low and high
RDW groups
Low RDW High RDW
(≤ 13.25)
(> 13.25)
Variables
(
n
= 46)
(
n
= 78)
p
-value
Gensini score
Total
11 [4–31]
43 [16–73]
< 0.001
LAD
5 [3–12]
18 [5-30]
0.001
Cx
3 [1–5]
7 [3–19]
< 0.001
RCA
2 [1–3]
7 [2–18]
< 0.001
Obstructive CAD
23 (50)
63 (81)
0.001
Triple-vessel disease
2 (4)
26 (33)
< 0.001
RDW: red cell distribution width, LAD: left anterior descending coronary artery,
Cx: circumflex coronary artery, RCA: right coronary artery, CAD: coronary
artery disease. Data are shown as n (%) or median [interquartile range].
Figure 1.
Receiver operating characteristic curve showing the relationship
between sensitivity and false positivity at various cut-off points for red cell
distribution width to predict coronary artery disease.