


 30 / 48

RESEARCH ARTICLE
SA JOURNAL OF DIABETES & VASCULAR DISEASE
68
VOLUME 14 NUMBER 2 • DECEMBER 2017
using the whole heart tissue
33
and isolated cardiomyocytes.
34
Cell
lysates were made after 30 minutes’ incubation with or without
insulin or melatonin (before the addition of 2DG). Thereafter the
cells were put on ice, transferred to Eppendorf tubes, quickly
centrifuged and washed three times with ice-cold medium buffer
without substrate. The resultant cell pellet was then lysed in 100 μl
of lysis buffer.
34
At this point the cells were sonicated on ice (three
times, intervals of three-second pulses with one-second break) and
centrifuged for 20 minutes. The subsequent pellet was discarded
and the supernatant used as cell lysate for Western blotting.
Total and phospho PKB/Akt (Ser-473) expressions were evaluated
in the cardiomyocytes after incubation with melatonin with or
without insulin, as previously described.
34
In addition, GLUT4
expression was evaluated in whole heart lysates after six weeks
of melatonin treatment, as previously described.
33
All antibodies
were purchased from Cell Signaling (USA). Beta-tubulin was used
as a loading control. Protein activation is expressed in arbitrary
densitometry units as phospho/total ratios.
Statistical analysis
Data are expressed as mean ± standard error of the mean (SEM).
When comparisons between two groups (treated and untreated)
were made, an unpaired Student’s t-test was performed. For
multiple comparisons, the ANOVA (two-way when appropriate),
followed by the Bonferroni correction was applied. Statistical
significance was considered for a
p
-value < 0.05.
Results
Effect of melatonin treatment
in vitro
on glucose
uptake by cardiomyocytes
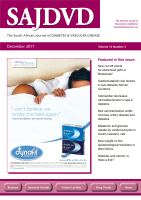
Compared to basal levels, melatonin treatment (10 and 100 nM,
10 and 50 μM) had no significant effect on glucose uptake by the
cardiomyocytes isolated from normal rats (Fig. 1A). Insulin (1 nM)
administration alone caused a 2.3-fold increase in glucose uptake
compared to basal levels (Fig. 1B). However, when insulin was
added to cells treated with melatonin (100 nM), there was a further
stimulation of glucose uptake (3.4 ± 0.5- vs 2.5 ± 0.2-fold increase,
p
< 0.05) (Fig. 1B). As melatonin at other concentrations (10 nM)
did not influence the levels of insulinstimulated glucose uptake (Fig.
1B) when compared to insulin alone, only 100 nM was used in
subsequent experiments.
Cardiomyocytes isolated from the control (C) and obese (D) rats
after 16 to 19 weeks of feeding, exhibited no significant difference
in basal as well as insulin-stimulated glucose uptake between the
two groups (Table 1, Fig. 2). As was observed in cardiomyocytes
isolated from normal rats (Fig. 1A), melatonin administration (100
nM) also had no significant effect on basal glucose uptake in group
C and D rats fed for 16 to 19 weeks (Table 1). However, it enhanced
the insulin-stimulated glucose uptake in group C compared to
group D rats (C: 73.9 ± 4.1 vs D: 47.5 ± 4.9 pmol/mg protein/30
min,
p
< 0.05) (Table 1, Fig. 2).
After 20 to 23 weeks of feeding, although the diet had no
significant effect on basal glucose uptake by isolated cardiomyocytes
Figure 1.
Effect of
in vitro
melatonin treatment on basal and insulin-stimulated glucose uptake by cardiomyocytes from young control rats (dose response).
Cardiomyocytes were isolated and incubated with melatonin and/or insulin for a period of 30 minutes. The accumulated radiolabelled 2 deoxyglucose (2DG) was
measured using a scintillation counter and expressed as pmol/mg protein/30 min. A: Effect on basal glucose uptake. Ins: insulin (1 nM), Mel: melatonin (Mel 1: 10 nM,
Mel 2: 100 nM, Mel 3: 10 μM, Mel4: 50 μM), **
p
< 0.01 (vs basal or melatonin),
n
(individual preparations):
n
= 12 (basal), 11 (Ins), three (Mel 1), eight (Mel 2), four
(Mel 3), three (Mel 4); analysed in duplicate. B: Effect on insulin-stimulated glucose uptake (fold stimulation). Ins: insulin (1 nM), Mel: melatonin (Mel 1: 10 nM, Mel2:
100 nM); *
p
< 0.05 (Ins vs Ins + Mel 2); **
p
< 0.05 (basal vs Ins or Ins + Mel 1 or 2);
n
= 12 (basal), 11 (Ins), five (Ins + Mel 1), six (Ins + Mel 2) individual preparations/
group; analysed in duplicate.
A
B
Table 1.
Body weight and visceral mass of rats fed for 16 to 19 weeks and their corresponding glucose uptake by the cardiomyocytes
Body weight and visceral fat mass
Glucose uptake (pmol/mg protein/30 min)
Group
Body weight (g)
Visceral fat (g)
Adiposity index
Basal
Insulin
Ins + Mel
Mel
C
435 ± 21
17.0 ± 1.4
3.8 ± 0.18
25.6 ± 2.8
49.3 ± 5.6* 73.9 ± 4.1***# 25.5 ± 4.4
D
517 ± 11###
33.3 ± 1.3###
6.39 ± 0.3###
20.8 ± 3.1
40.8 ± 3.8*
47.5 ± 4.9*
20.0 ± 3.4
n
6
6
6
6
6
4
6
C: control, D: high-calorie diet, adiposity index = [(visceral fat/body weight) × 100], Ins: insulin (1 nM), Mel: melatonin (100 nM), *
p
< 0.05 (vs basal), ***
p
< 0.001
(vs basal), #
p
< 0.05 (vs D), ###
p
< 0.001 (vs C),
n
= four to six individual preparations per group, uptake determined in duplicate for each preparation