
SA JOURNAL OF DIABETES & VASCULAR DISEASE
RESEARCH ARTICLE
VOLUME 14 NUMBER 2 • DECEMBER 2017
69
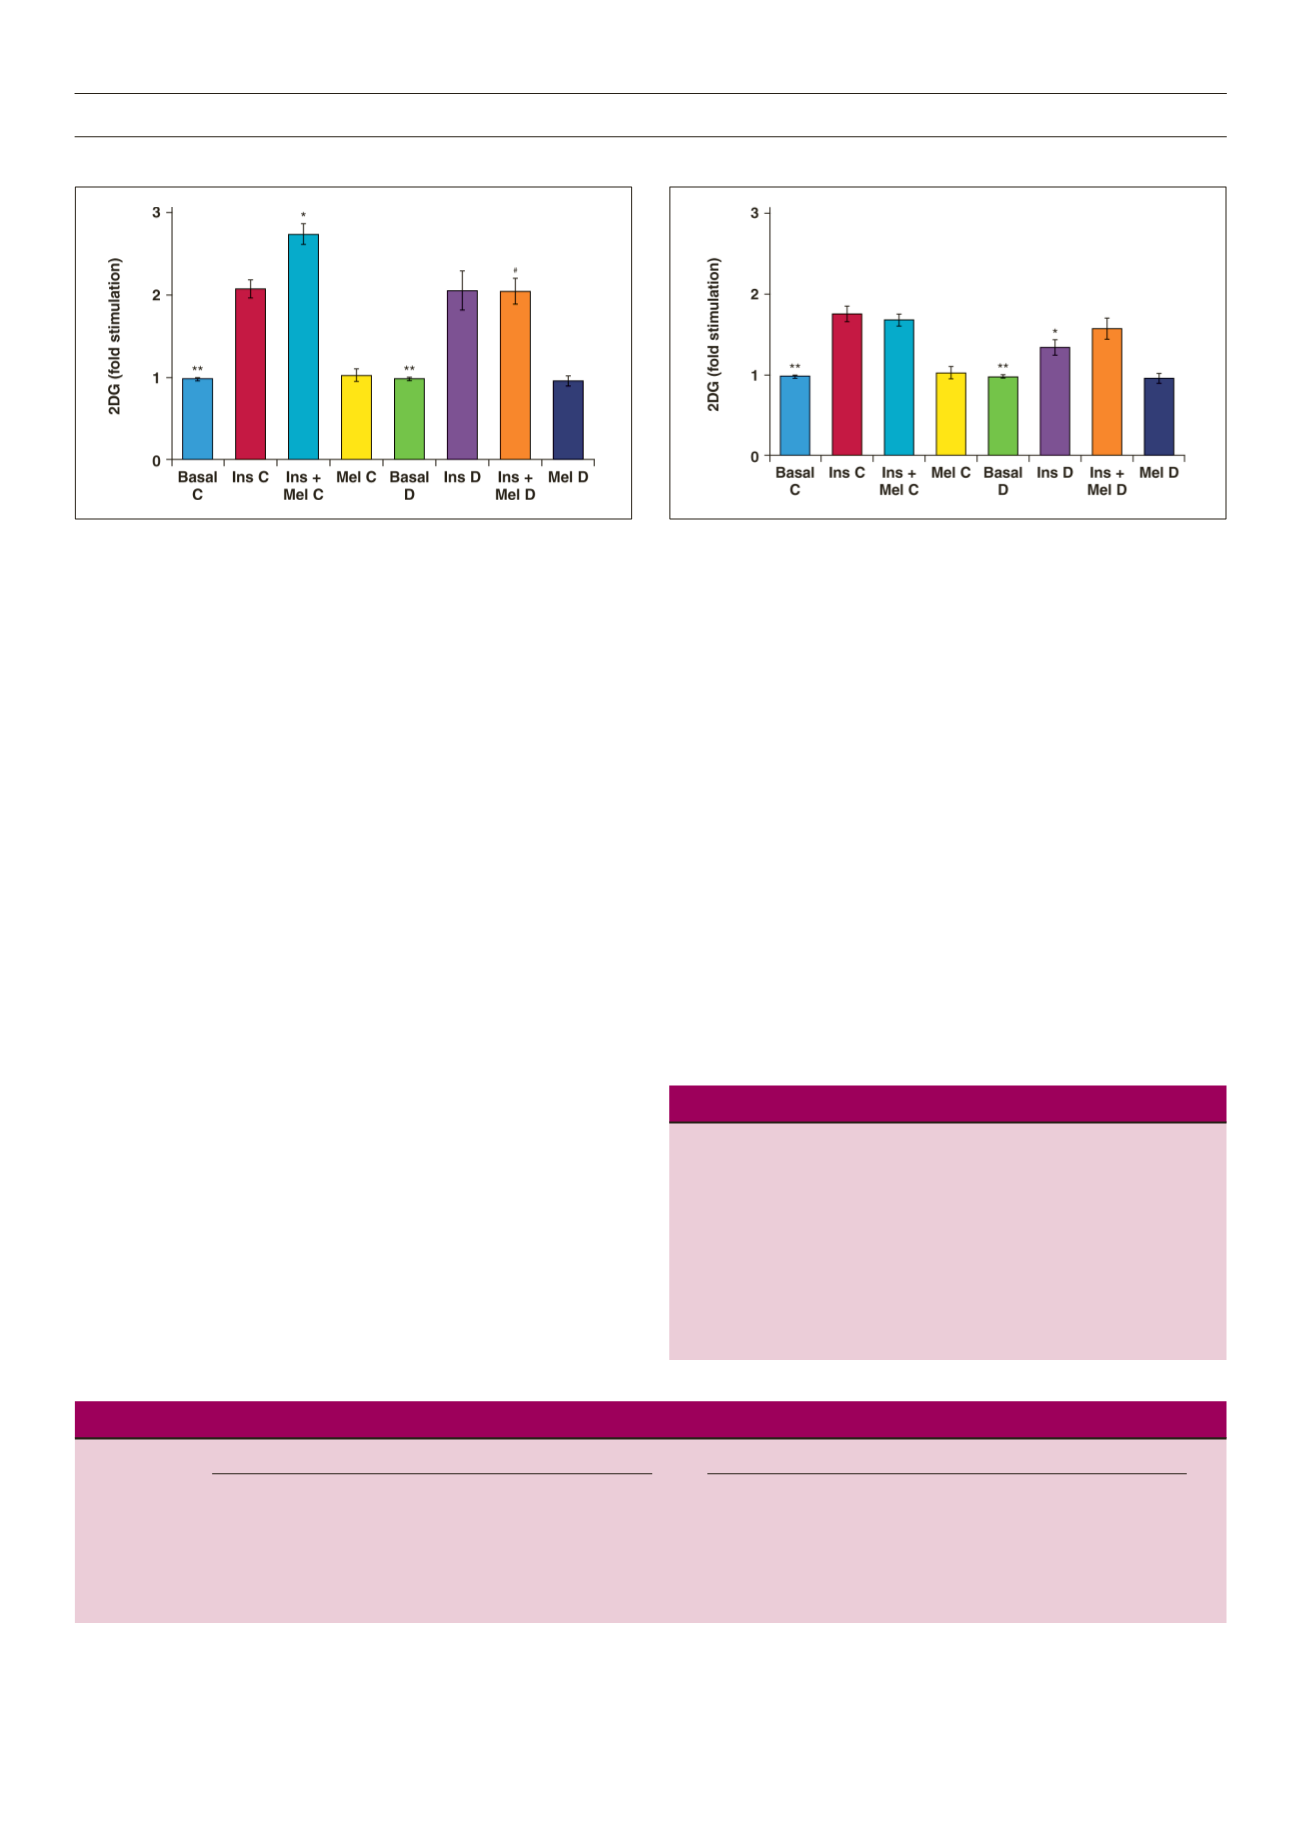
(Table 2), insulin-stimulated glucose uptake was significantly lower
in group D rats compared with the control group (C: 35.3 ± 6.3
vs D: 25.9 ± 1.6 pmol/mg protein/30 min,
p
< 0.05) (Fig. 3), while
melatonin treatment had no effect on insulinstimulated glucose
uptake in both group C and D rats (Fig. 3).
Effect of melatonin treatment
in vivo
on glucose uptake by
insulin-resistant cardiomyocytes
After 20 to 23 weeks, rats fed a high-calorie diet exhibited
significantly increased body weight (C: 433 ± 25 vs D: 538 ± 43 g,
p
< 0.05), visceral fat mass (C: 17.7 ± 1.8 vs D: 37.5 ± 7.5 g,
p
<
0.001) as well as adiposity index (Table 3). Melatonin treatment for
six weeks reduced body weight and adiposity index values in group
D rats (
p
< 0.05) (Table 3).
To evaluate the glucose uptake by cardiomyocytes from control
and obese rats, a dose response with increasing concentrations
of insulin was performed (Fig. 4). The diet had no effect on basal
glucose uptake by cardiomyocytes isolated from both group C and
D rats (Fig. 4). However it reduced insulin-stimulated glucose uptake
in group D rats (Fig. 4, Table 2). Oral melatonin treatment
in vivo
for six weeks increased the basal glucose uptake by cardiomyocytes
from group D rats (DM: 26.4 ± 2.1 vs D: 19.8 ± 3.4 pmol/mg
protein/30 min,
p
< 0.05) while having no effect in group C rats
(CM: 22.6 ± 3.7 vs C: 21.1 ± 3.5 pmol/mg protein/30 min,
p
>
0.05) (Fig. 4). Additionally, compared to their respective untreated
group, cardiomyocytes isolated from the control treatment group
(CM) had elevated insulin-stimulated glucose uptake (
p
< 0.05)
(Fig. 4). Furthermore, cardiomyocytes from the D treatment
group (DM) also showed a further elevation of insulin-stimulated
glucose uptake with insulin administration (100 nM), compared to
the untreated group (DM: 50.1 ± 1.7 vs D: 32.1 ± 5.1 pmol/mg
protein/30 min,
p
< 0.01) (Fig. 4).
Effect of melatonin treatment
in vivo
on IPGT test in insulin-
resistant rats
A high-calorie diet increased basal fasting blood glucose levels
compared to the control diet (5.2 ± 0.28 vs 6.4 ± 0.17 mM,
p
<
0.05). Similarly, at the end of the test, group D rats continued to
have elevated glucose levels (4.5 ± 0.2 vs 5.2 ± 0.1 mM,
p
< 0.05),
compared to the control group (Fig. 5). The area under the curve
was also elevated in group D rats, compared to the controls (870.7
± 25.6 vs 761.8 ± 27.7,
p
< 0.05) (Table 3). However, despite a
significant decrease in blood glucose levels in the melatonin-treated
Table 2.
Body weight and visceral mass of rats fed for 20 to 23 weeks and their corresponding glucose uptake by the cardiomyocytes
Body weight and visceral fat mass
Glucose uptake (pmol/mg protein/30 min)
Group
Body weight (g)
Visceral fat (g)
Adiposity index
Basal
Insulin
Ins + Mel
Mel
C
457 ± 14
18.4 ± 10.9
4 ± 0.2
19.9 ± 2.6**
35.3 ± 6.3#
33.5 ± 5.9
19.2 ± 1.7
D
575 ± 61###
38.7 ± 2.6###
6.7 ± 0.6###
18.1 ± 1.6**
25.9 ± 1.6
27.8 ± 1.1
18.4 ± 2.3
n
6
6
6
6
6
5
6
C: control, D: high-calorie diet, adiposity index [(visceral fat/body weight) × 100], Ins: insulin (1 nM), Mel: melatonin (100 nM), **
p
< 0.01 (vs Ins or Ins + Mel),
#
p
< 0.05 (vs D), ###
p
< 0.001 (vs C),
n
= five to six individual preparations per group, uptake determined in duplicate for each preparation.
Table 3.
Body weight, visceral fat mass
Parameters
C
CM
D
DM
BBody weight (g) 433 ± 25 411 ± 17 538 ± 43*** 488 ± 21#
Visceral fat (g)
17.7 ± 1.8 14.33 ± 1.9* 37.50 ± 7.5*** 28 ± 4#
Adiposity index 4.1 ± 0.2 3.4 ± 0.16* 6.9 ± 0.23*** 5.7 ± 0.3#
AUC for IPGT 761.5 ± 27.7 760.2 ± 38.8 870.7 ± 25.2* 826.7 ± 32.5
n
6
6
6
6
C: control, D: high-calorie diet, CM and DM: control and diet receiving mela-
tonin for six weeks, adiposity index [(visceral fat/body weight) × 100], AUC:
area under the curve, IPGT: intraperitoneal glucose tolerance, *
p
< 0.05 (vs C),
***
p
< 0.001(vs C), #
p
< 0.05 (vs D),
n
= six per group.
Figure 2.
Effect of
in vitro
melatonin treatment on insulin-stimulated glucose
uptake of cardiomyocytes isolated from control (C) and high-calorie diet (diet-
induced obesity) (D) groups after 16 to 19 weeks. 2DG: 2 deoxyglucose, Ins:
insulin (1 nM), Mel: melatonin (100 nM); *
p
< 0.05 (Ins C vs Ins + Mel C), **
p
<
0.01(basal vs Ins or Ins + Mel; Ins C vs Ins D),
#
p
< 0.05 (Ins + Mel D vs Ins + Mel
C),
n
= four to six individual preparations/group; analysed in duplicate.
Figure 3.
Effect of
in vitro
melatonin treatment on insulin-stimulated glucose
uptake of cardiomyocytes isolated from control (C) and high-calorie diet (diet-
induced obesity) (D) groups after 20 to 23 weeks. 2DG: 2 deoxyglucose, Ins:
insulin (1 nM), Mel: melatonin (100 nM); *
p
< 0.05 (Ins C vs Ins D), **
p
< 0.01
(basal vs Ins or Ins + Mel),
n
= four to six individual preparations/group; analysed
in duplicate.


