


 38 / 48

RESEARCH ARTICLE
SA JOURNAL OF DIABETES & VASCULAR DISEASE
76
VOLUME 14 NUMBER 2 • DECEMBER 2017
sociodemographic variables, and comparisons between males and
females in both environments are summarised in Table 1. The results
show that men and women differed for all the factors studied
except for age in both environments, and for WHR in Dakar.
In Dakar, the prevalence of underweight, overweight and general
obesity in terms of BMI was 12.6% (95% CI: 10.5–14.7), 19.2%
(95% CI: 16.7–21.7) and 9.7% (95% CI: 7.9–11.5), respectively.
The prevalence of central obesity was 26.0% (95% CI: 23.3–28.7)
using WC, and 39.9% (95% CI: 36.8–43.0) using WHR (Table 2).
In Tessekere, the prevalence of underweight, overweight
and general obesity in terms of BMI was 29.6% (95% CI: 25.6–
33.6), 13.3% (95% CI: 10.3–16.3) and 2.8% (95% CI: 1.3–4.3),
respectively. The prevalence of central obesity was 11.9% (95% CI:
9.1–14.7) using WC, and 23.6% (95% CI: 19.9–27.3) using WHR
(Table 2).
Dakar residents were more often overweight and obese and less
often thin than the Tessekere inhabitants [
χ
² (3 df) = 80.9;
p
<
0.001]. Likewise, they showed higher central obesity rates than the
Tessekere inhabitants [WC:
χ
² (1 df) = 39.3,
p
< 0.001; WHR:
χ
² (1
df) = 39, p < 0.001].
In Dakar as in Tessekere, bivariate analyses showed that all the
sociodemographic factors studied were associated with general
and central obesity (Table 3). The prevalence of general and central
obesity rose gradually with age in both environments, except for
obesity based on WC in Tessekere, which reached its highest rate
among people between the ages of 40 and 49 years.
In the urban and rural areas studied, general obesity affected
women six times more often than men, and their WC exceeded the
threshold of obesity 11 times and 18 more often than men in Dakar
and Tessekere, respectively.
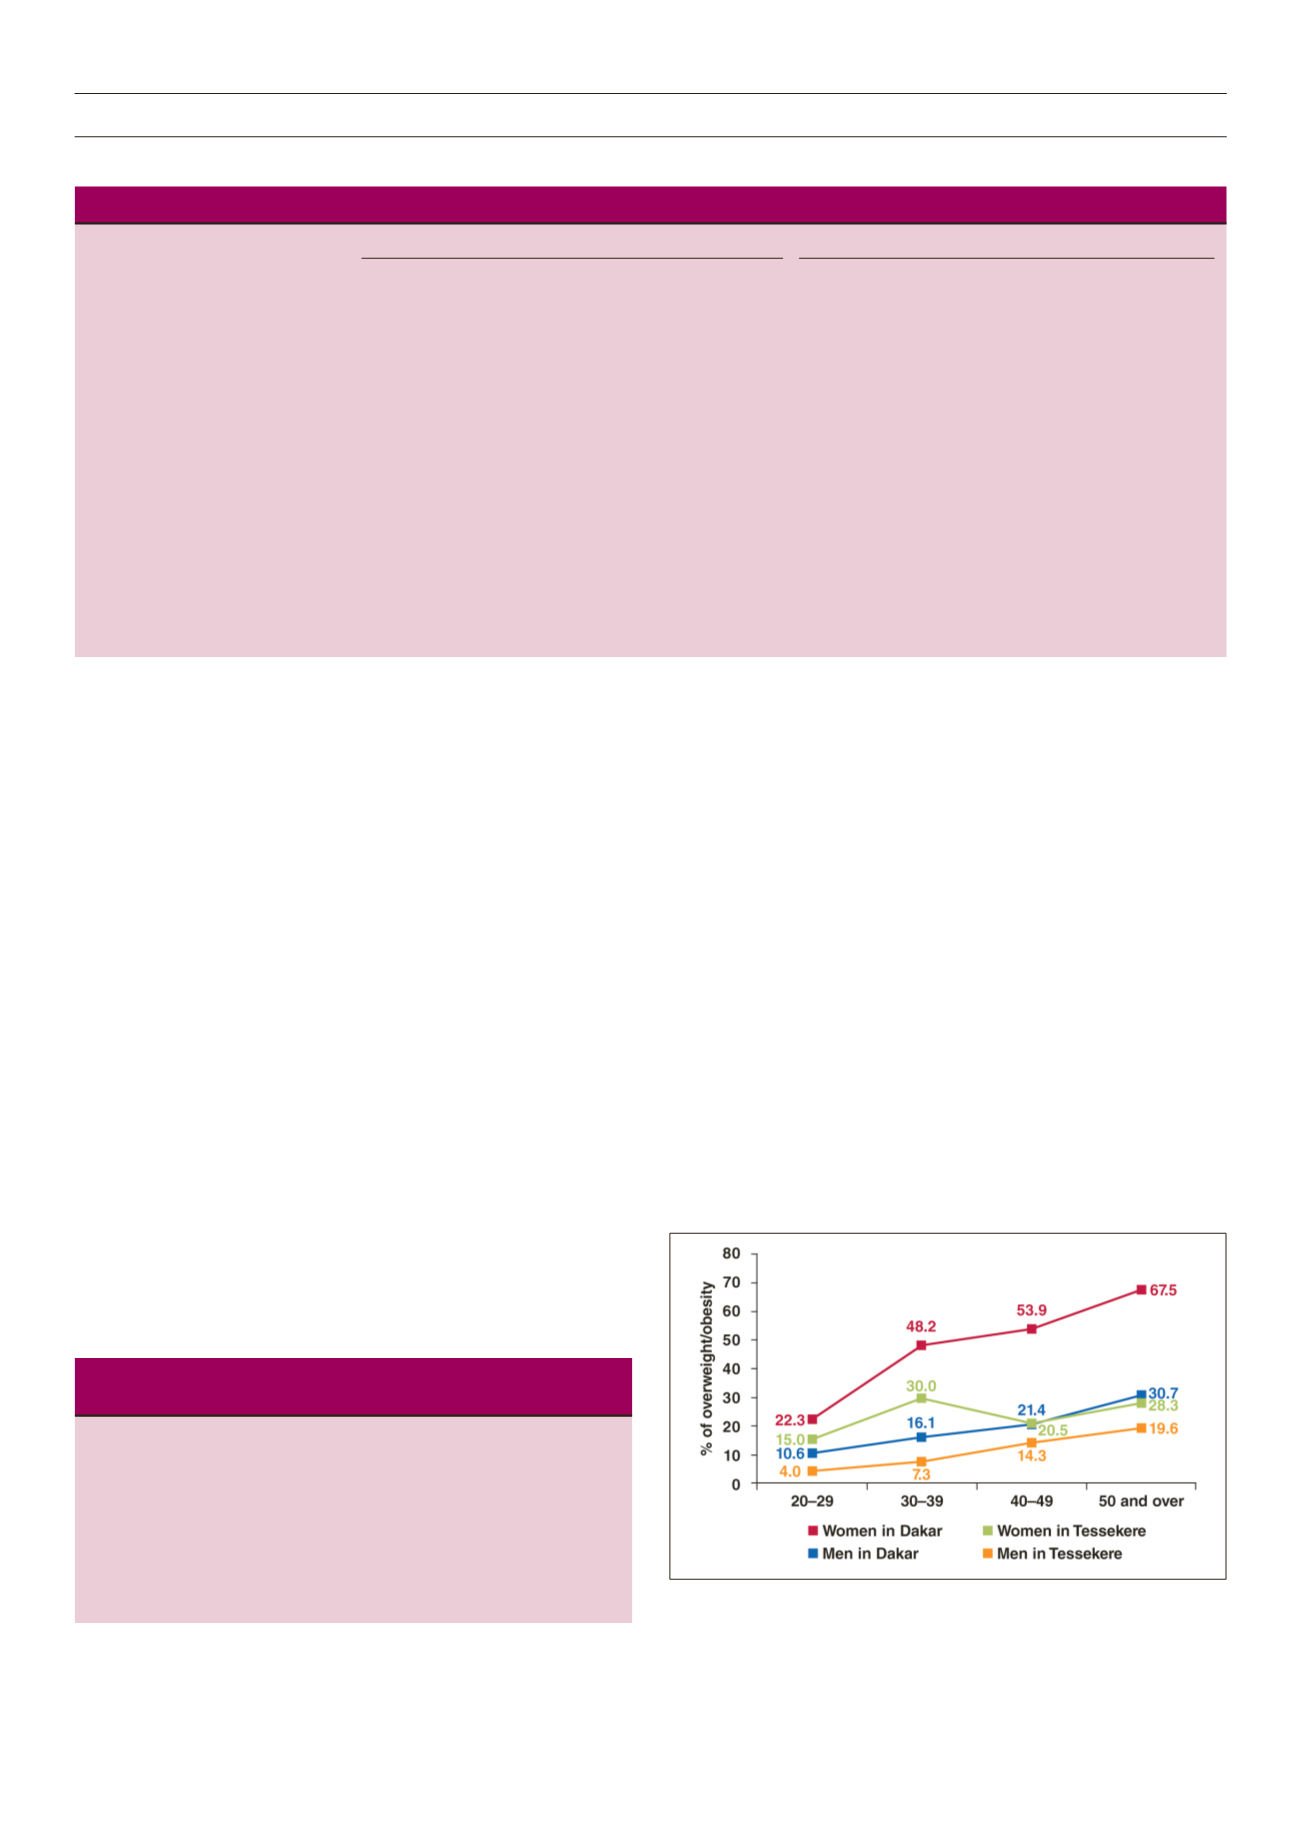
As shown in Fig. 1, the prevalence of overweight/obesity (using
BMI) rose with age among men and women in Dakar. The same
pattern was observed among men in Tessekere. However, among
rural women, the prevalence of overweight/obesity reached its
highest rate between the ages of 30 and 39 years.
Multivariate analyses showed that age and gender were the
primary risk factors for overweight/obesity in Dakar and Tessekere
(Table 4). Educational level also showed significant associations
with BMI ≥ 25 kg/m², but only in the urban area, where people with
between one and eight years of schooling had greater chances of
being overweight or obese than people who attended university.
Gender was the primary risk factor for central obesity (WC and
WHR) in both environments (Table 4).
In Dakar, 50% of the study participants were satisfied with their
weight, 27% thought they were too thin and 23% too fat. Men
were more often satisfied with their weight than women (57 vs
43%), who in turn more often thought themselves too heavy (33 vs
Table 1.
Demographic and anthropomatic characteristics of the sample
Dakar
Tessekere
Total
Male
Female
Total
Male
Female
Characteristics
(
n
= 984)
(
n
= 494)
(
n
= 490)
p
-value (
n
= 496)
(
n
= 241)
(
n
= 255)
p
-value
Age (years)
35.70 ± 13.16 35.89 ± 13.27 35.51 ± 13.07 0.652
37.33 ± 15.25 37.26 ± 15.45 37.40 ± 15.08 0.917
Height (cm)
172.56 ± 9.87 178.96 ± 8.07 166.11 ± 6.88 < 0.001 169.63 ± 10.38 175.85 ± 8.09 163.75 ± 8.77 < 0.001
Weight (kg)
69.28 ± 14.44 70.21 ± 16.67 68.34 ± 16.00 0.043
60.25 ± 12.32 62.38 ± 11.26 58.23 ± 12.96 < 0.001
BMI (kg/m²)
23.33 ± 4.89
21.91 ± 3.54
24.76 ± 5.59 < 0.001 20.97 ± 4.07
20.15 ± 3.24 21.74 ± 4.60 < 0.001
General obesity,
n
(%)
95 (9.7)
14 (2.8)
81 (16.5)
< 0.001
14 (2.8)
2 (0.8)
12 (4.7)
0.009
WC (cm)
84.31 ± 13.02 81.51 ± 10.65 87.14 ± 14.51 < 0.001 77.25 ± 10.59 76.13 ± 9.31 78.32 ± 11.59 0.021
Central obesity by WC,
n
(%)
256 (26)
21 (4.3)
235 (48)
< 0.001
59 (11.9)
3 (1.2)
56 (22.?)
< 0.001
WHR
0.836 ± 0.081 0.837 ± 0.069 0.834 ± 0.092 0.579
0.839 ± 0.079 0.847 ± 0.075 0.831 ± 0.082 0.019
Central obesity by WHR, n (%)
393 (39.9)
83 (16.8)
310 (63.3)
< 0.001
117 (23.6)
17 (7.1)
100 (39.2)
< 0.001
Educational level (Dakar/Tessekere),
n
(%)
< 0.001
0.006
None/none
208 (21.1)
84 (27)
124 (25.3)
373 (75.2)
168 (69.7)
205 (80.4)
Primary/1 year or +
348 (35.5)
163 (33)
185 (37.8)
123 (24.8)
73 (30.3)
50 (19.6)
Intermediate
197 (20)
109 (22.1)
88 (18)
Secondary
91 (9.2)
51 (10.3)
40 (8.2)
University
140 (14.2)
87 (17.6)
53 (10.8)
BMI: body mass index, WC: waist circumference, WHR: waist–hip ratio.
Table 2.
Prevalence (%) of underweight, overweight, general obesity
and central obesity by place of residence
Criterion
Category
Dakar
Tessekere
BMI
Underweight
12.6 (10.5–14.7)
29.6 (25.6–33.6)
Overweight
19.2 (16.7–21.7)
13.3 (10.3–16.3)
General obesity
9.7 (7.9–11.5)
2.8 (1.3–4.3)
WC
Central obesity
26.0 (23.3–28.7)
11.9 (9.1–14.7)
WHR
Central obesity
39.9 (36.8–43.0)
23.6 (19.9–27.3)
BMI: body mass index, WC: waist circumference, WHR: waist-hip ratio.
In brackets: 95% confidence limits.
Figure 1.
Age- and gender-specific prevalence (%) of overweight/obesity in
Dakar and Tessekere.