


 33 / 48

SA JOURNAL OF DIABETES & VASCULAR DISEASE
RESEARCH ARTICLE
VOLUME 14 NUMBER 2 • DECEMBER 2017
71
by cardiomyocytes, and its expression would give more insight.
45
Therefore, it may be that there was an increase in the expression
or membrane translocation of GLUT1 in these cardiomyocytes from
obese rats treated with melatonin. In addition, insulin was able
to elicit a significant response in untreated control animals, while
this was not the case in the obese animals after 20 to 23 weeks.
This observation could be explained by the insulin-resistant state
of the cells from the obese animals compared to their controls.
Interestingly, cardiomyocytes prepared from control as well as
obese animals treated with melatonin showed a significantly higher
response to insulin than the untreated counterparts (Fig. 4).
With regard to the effect of melatonin on glucose tolerance, the
present data show that obese rats developed glucose intolerance,
and melatonin had no effect on basal glucose levels (10:00–12:00).
While data on nocturnal glucose levels may be different, six-week
melatonin treatment also reduced systemic insulin resistance in
obese rats without affecting basal fasting blood glucose levels.
33
These results are consistent with previous findings:
46
between 15
and 25 minutes following glucose injection, obese melatonin-
treated rats had a significant decrease in blood glucose levels
compared to the untreated obese group, somehow indicating their
increased ability to absorb glucose.
The reduction in insulin resistance or improved glucose uptake
and utilisation may involve changes in the metabolic profile, such
as increasing adiponectin levels after long-
13,23
and short-term
33
melatonin administration. Melatonin-induced beneficial changes in
adipose tissue
41,47
may in turn additionally contribute to improved
whole-body insulin sensitivity. Moreover, as indicated above,
melatonin may improve glucose homeostasis via its actions in the
hypothalamus and liver.
48
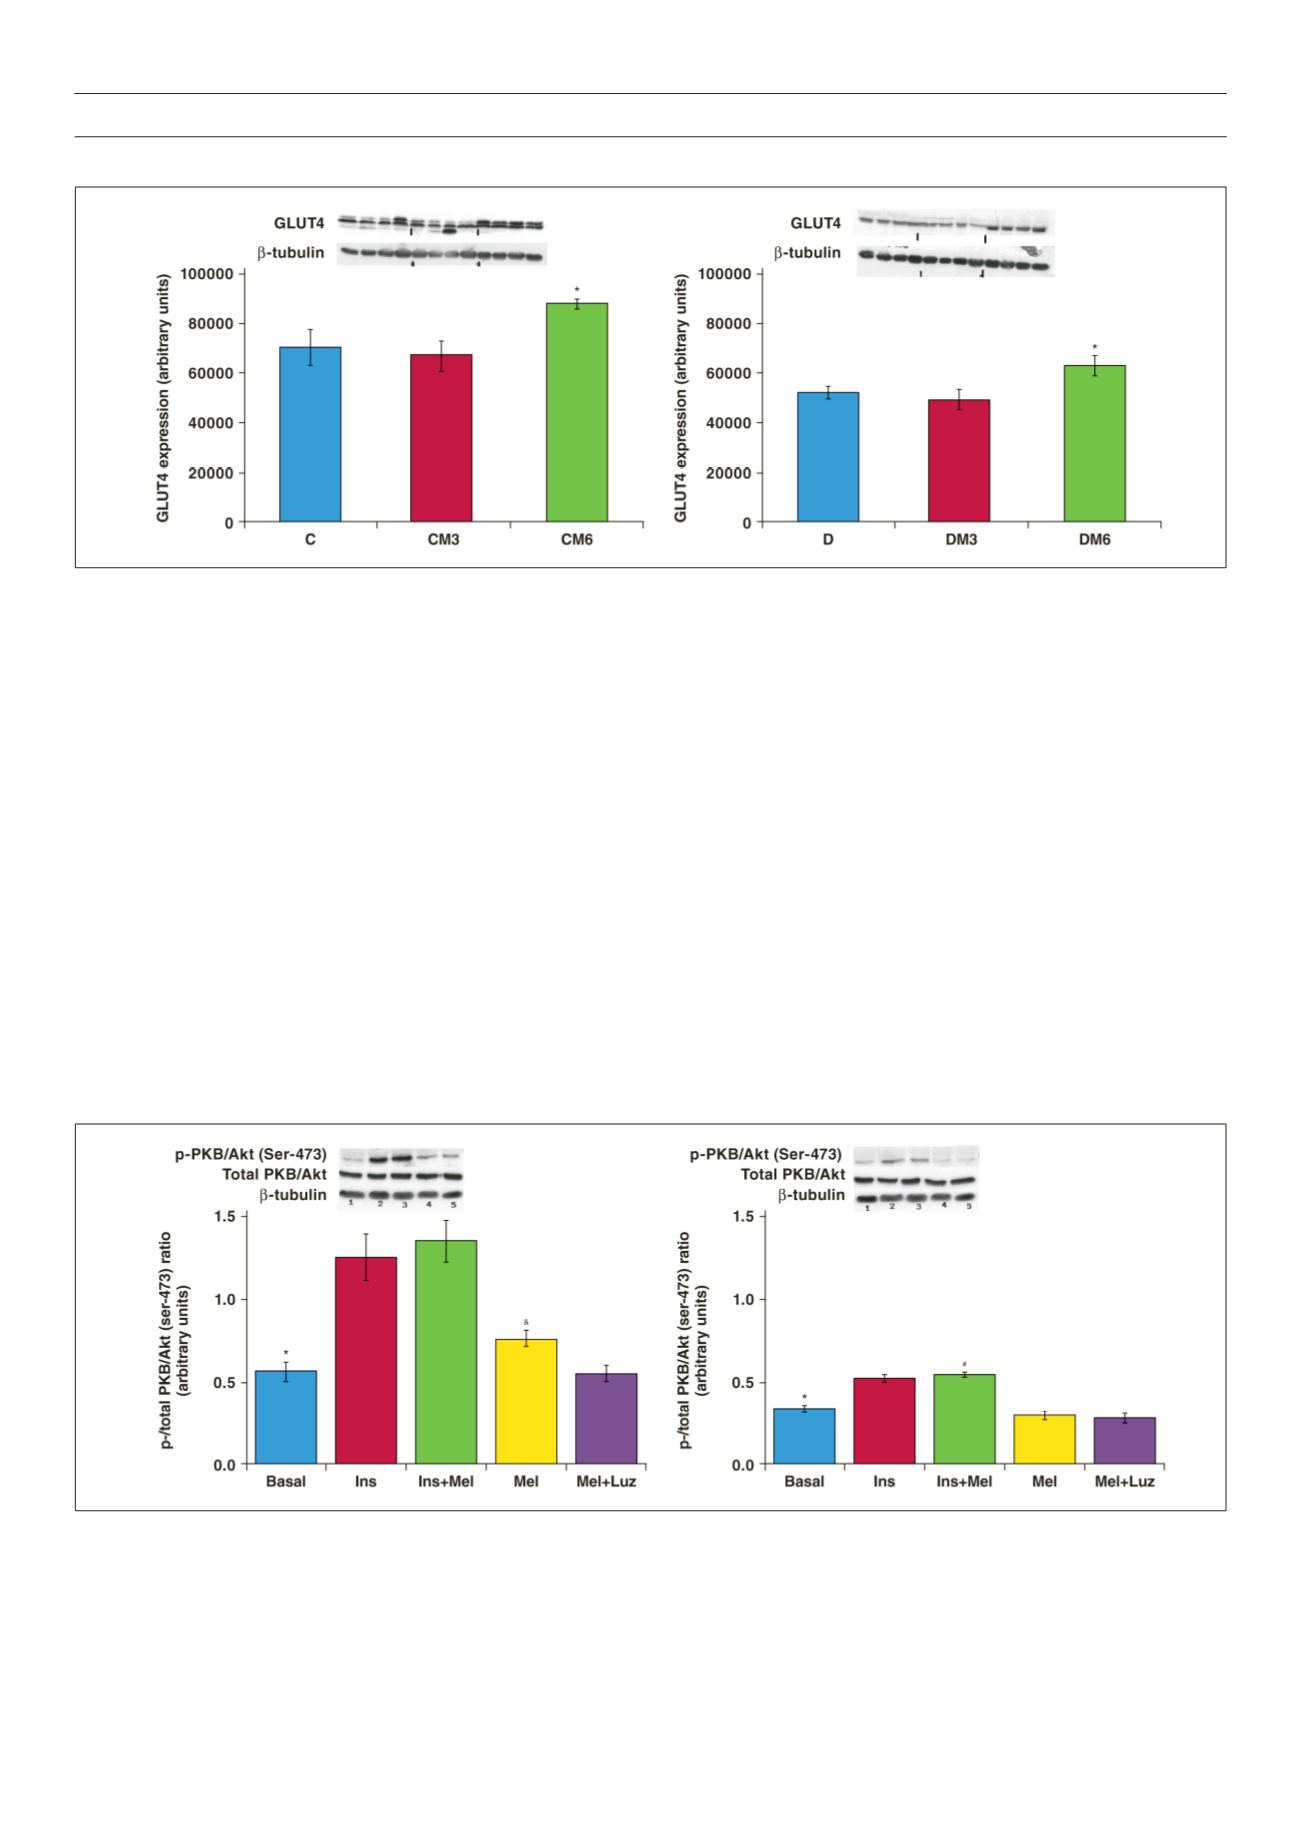
Figure 6.
The effects of melatonin treatment on GLUT4 expression after three and six weeks of treatment. Hearts were isolated from rats fed a high-calorie diet for 20
weeks and their age-matched controls. Both control and obese groups received drinking water with/without melatonin (4 mg/kg/day) for three or six weeks starting
after 14 weeks of feeding. C: control group, D: highcalorie diet (obesity) group; CM3, DM3, CM6 and DM6: group C and D rats receiving melatonin treatment for
three weeks (M3) or six weeks (M6); beta-tubulin was used as a loading control. C and D performed on the different blot (
p
> 0.05 C vs D), *
p
< 0.05 (CM6 vs C) or
DM6 vs D,
n
= four hearts/group.
Figure 7.
Effects of
in vitro
melatonin administration to isolated cardiomyocytes on PKB/Akt expression and phosphorylation (rats fed for 20 weeks). Cardiomyocytes
were isolated and incubated with melatonin with or without insulin stimulation. C: control, D: high-calorie diet. 1: basal, 2: Ins (insulin), 3: Insulin + melatonin, 4: Mel
(melatonin), 5: luzindole + melatonin, Luz (luzindole), C: *
p
< 0.05 (Ins or Ins + Mel vs basal), and
p
< 0.05 (Mel vs basal or Mel + Luz), D: *
p
< 0.05 (Ins or Ins + Mel
vs basal), #
p
< 0.05 (D vs C), n = three individual preparations/group. Blots are representative. Beta-tubulin was used as a loading control. C and D performed on the
same blot.