
VOLUME 15 NUMBER 1 • JULY 2018
33
SA JOURNAL OF DIABETES & VASCULAR DISEASE
ACHIEVING BEST PRACTICE
policies are unclear. In fact, the current PHC package of services
available at PHC level and the Human Resources for Health plans do
not mention foot health services or integration of (podiatric) such
services as part of services to be offered at PHC level of care.
21,22
There is, however, a need to understand and document the
factors that predispose diabetic patients to the risk of ulceration,
together with an appreciation of the links between different aspects
of the disease processes and foot function. This is necessary for
the prevention and management of diabetic foot complications.
Therefore, this article focuses on the risk factors for diabetic foot
ulceration recorded in patients presenting at two PHC clinics.
Methods
A descriptive, cross-sectional study was conducted over a period
of 14 weeks between June and September 2013 at two PHCs
in Johannesburg. The participating clinics were selected using
homogeneous sampling methods with one clinic located in the
inner city and the other in a township. Patients presenting at the
participating clinics were asked to participate in the study and 1 077
patients consented to taking part in the study. Those patients who
agreed to participate had their medical data recorded and their feet
inspected by a clinic nurse, assisted by a final-year podiatry student.
Data were collected as part of routine patient consultation and
captured on a self-constructed data-collection form (DCF).
The DCF had four sections, which dealt with demographics,
the presence of foot-related complaints, presenting systemic or
joint condition, and current management of patients with foot
complaints presenting at PHCs. The form was pre-tested at another
PHC in Johannesburg before being used for data collection in the
study. Simple descriptive statistics were undertaken to analyse data,
which included performing basic frequencies, an inferential method
for comparing groups, and a comparative analysis of demographics
was completed using comparative inferential statistics.
Ethical clearance for the study was obtained from the University
of Johannesburg, Faculty of Health Sciences, research ethics
committees (REC-241112-035). Permission to access the selected
clinics for data-collection purposes was granted by the executive
director of the City of Johannesburg Health Department.
Fig. 1.
Age spread of patients.
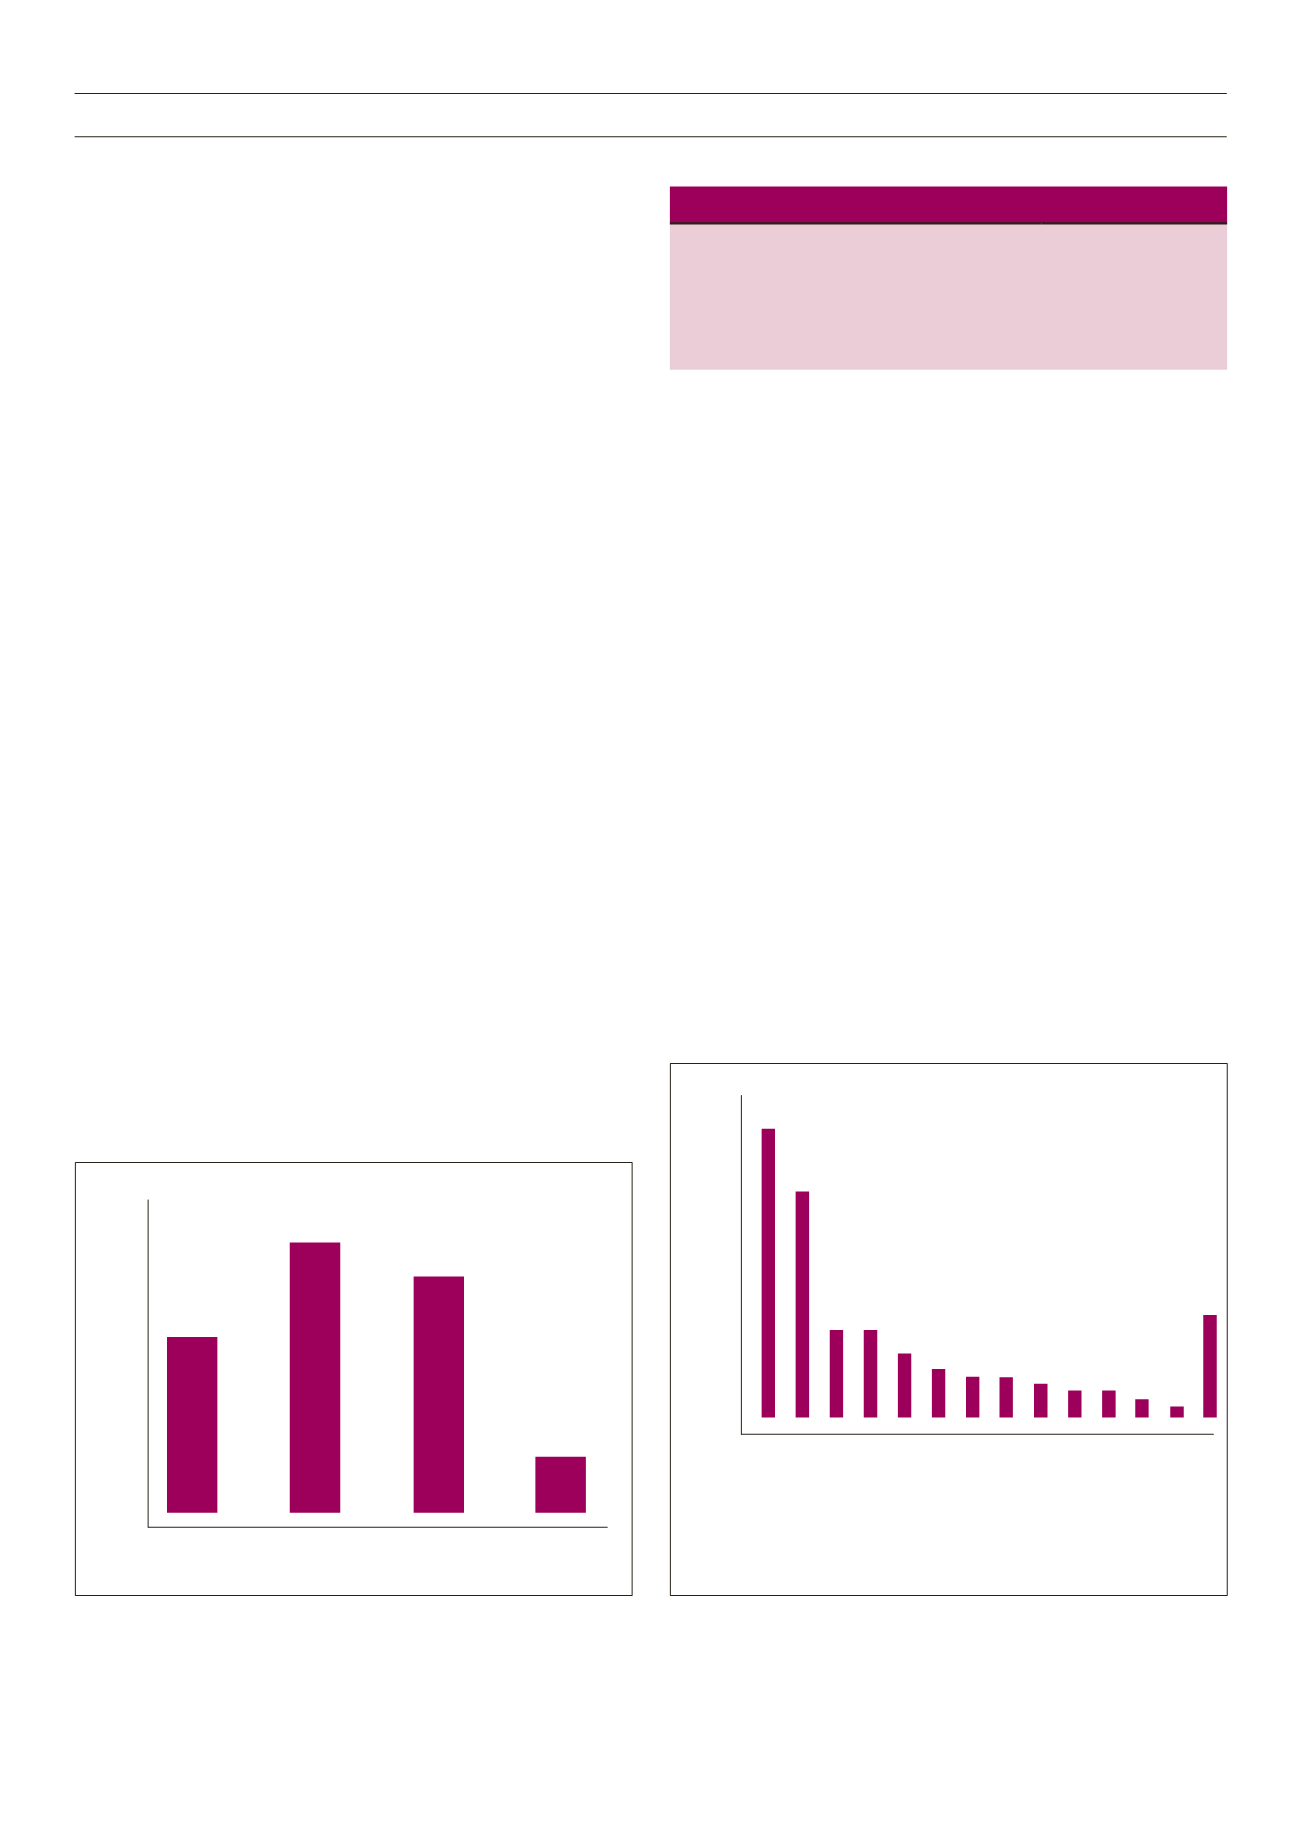
Fig. 2.
Systemic disease or joint condition.
Table 1.
Diabetic foot risk factors
Risk factor
Prevalence,
n
(%)
Neuropathy
236 (75)
Structural deformities
147 (47)
Peripheral vascular disease symptoms
124 (39)
Foot ulcers
87 (28)
Results
Data were analysed from the 1 077 completed DCFs, 442 from
one clinic and 635 from the other. No patient-identifying data were
collected as part of the study, only gender, population group and
age were collected as part of the demographic data for this study.
Three hundred and fourteen patients were confirmed as having
diabetes, based on their medical records.
Overall analysis of the 1 077 DCFs gathered showed that 33%
(
n
= 356) were male and 62% (
n
= 672) were female patients.
The gender of the remaining 5% (
n
= 49) could not be decided as
the forms were not properly completed concerning this question.
The mean age was between 46 and 49 years. The age spread of
patients in is presented in Fig. 1.
Black Africans were the majority population group in this study
at 51%, followed by coloureds (mixed ancestry) at 25%. Whites
and Indians made up 3 and 9%, respectively and in 12% of the
DCFs, the population group was not documented.
In total, 54% (
n
= 583) of patients presenting at the two PHCs
had a systemic disease or joint condition. Diabetes was recorded in
29% (
n
= 314) of the patients whose data were collected in this
study. Systemic conditions recorded are presented in Fig. 2.
The risk factors for diabetic foot ulcerations recorded in this
study are presented in Table 1. Foot pathologies and or symptoms
that were recorded in diabetic patients are presented Table 2.
40%
35%
30%
25%
20%
15%
10%
5%
0%
0–25 years
258/1077
26–45 years
398/1077
46–65 years
355/1077
66–75 years
67/1077
24%
37%
33%
6%
40%
35%
30%
25%
20%
15%
10%
5%
0%
Hypertension 409/1077
Diabetes 314/1077
Arthritis 118/1077
Knee pain 121/1077
Lower back pain 91/1077
HIV/AIDS 64/1077
Hip pain 59/1077
Tubercolosis 55/1077
Poor eyesight 42/1077
Mental diseases 30/1077
Poor circulation 27/1077
Stroke 16/1077
Obesity 16/1077
Unknown 74/1077
38%
29%
11%11%
8%
6% 5% 5% 4% 3% 3% 2% 1%
7%


