
SA JOURNAL OF DIABETES & VASCULAR DISEASE
RESEARCH ARTICLE
VOLUME 17 NUMBER 1 • JULY 2020
17
Results
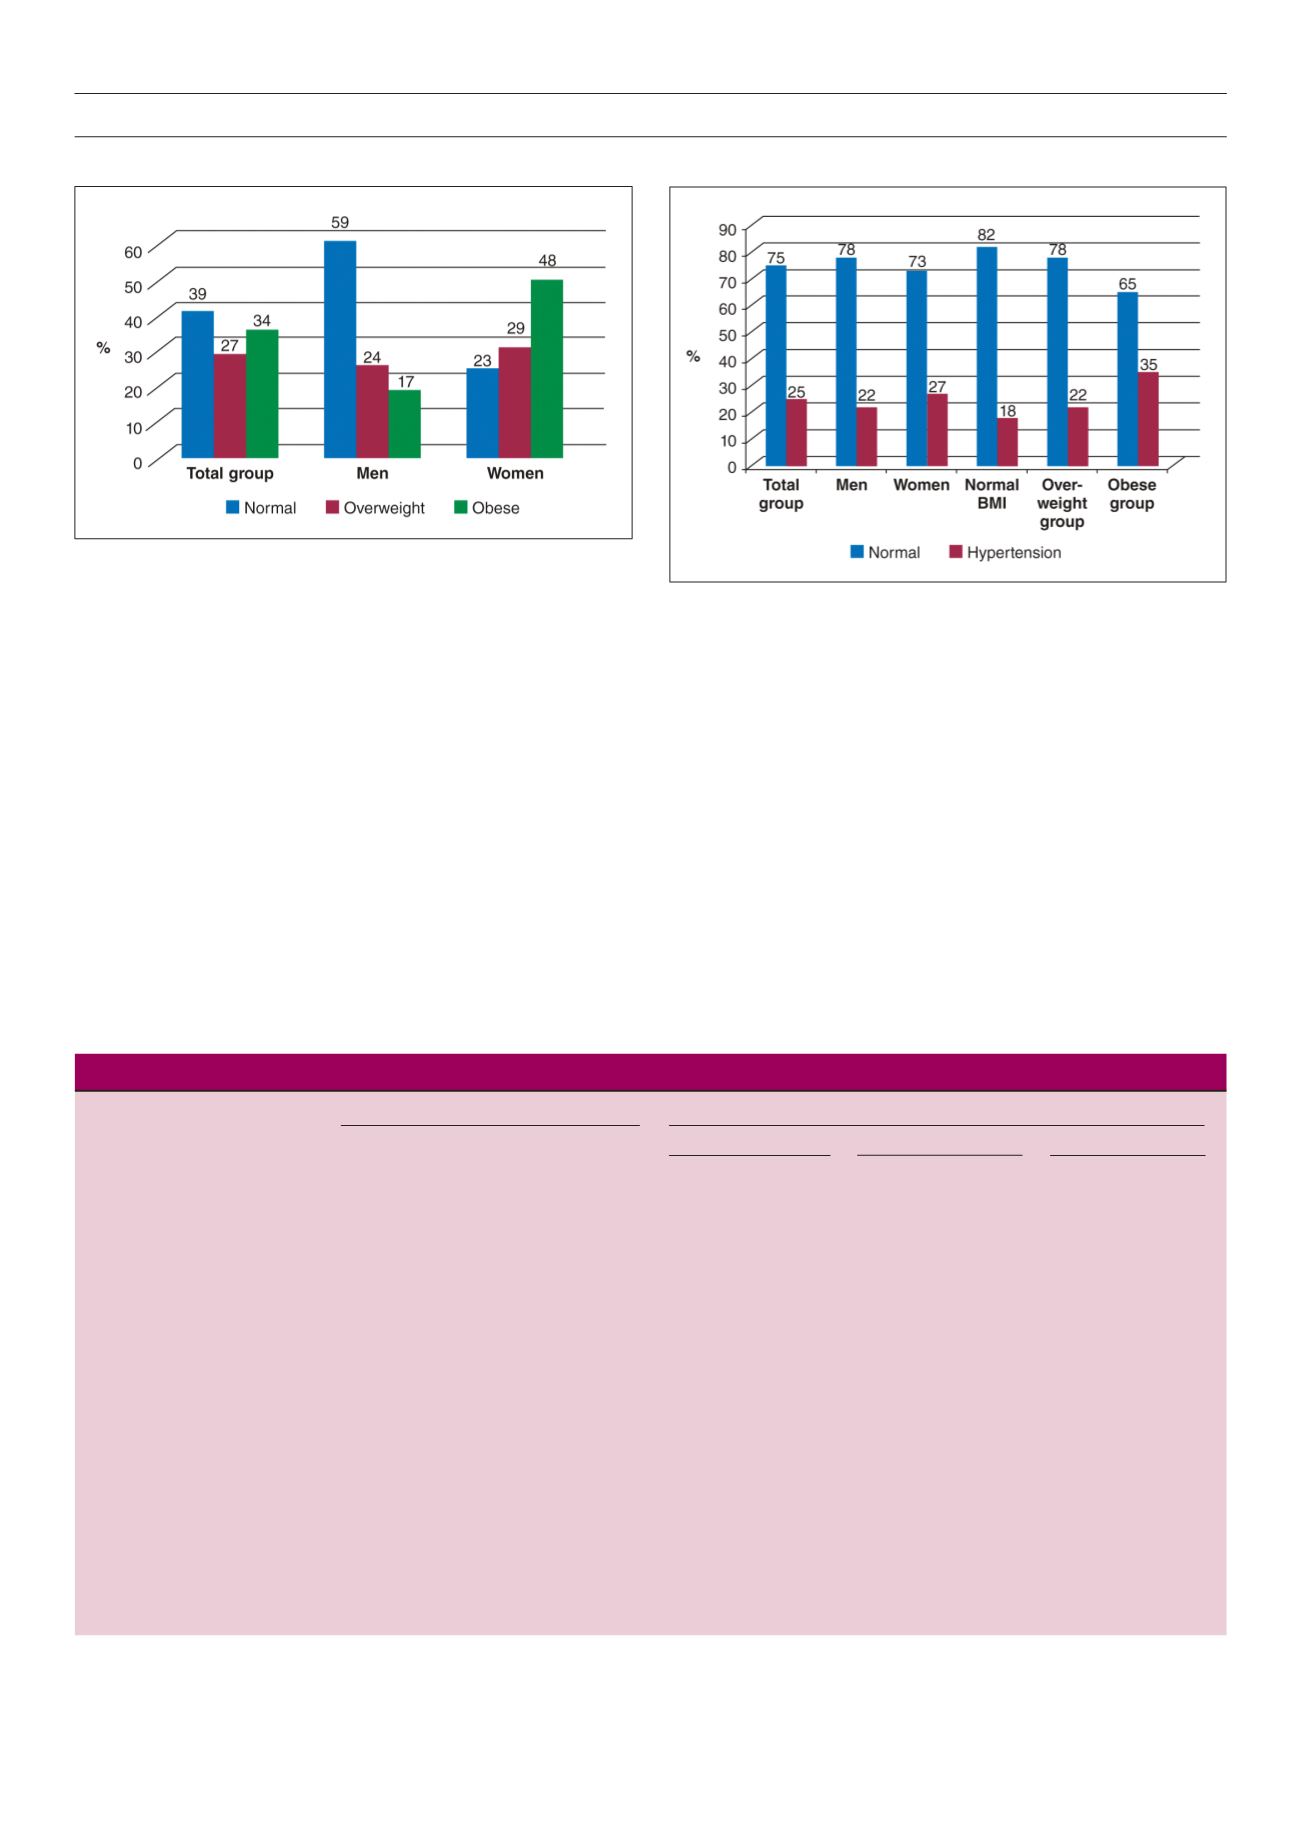
Fig. 1 presents the percentage for BMI categories for the total
group and by gender. The results show that of the total group, 39%
had normal weight, 27% were overweight and 34% were obese.
The findings also indicate that 29% of women were overweight
compared to 24% of men. Similarly 48% of women were obese in
comparison to 17% of men.
Fig. 2 presents the percentage of hypertension for the total
group by gender and BMI categories. In the total group, the results
show that 25% of the employees presented with hypertension in
which the women (27%) were more affected than men (22%).
When the data were analysed according to BMI categories, the
results showed a significantly higher percentage of hypertension in
both the overweight and obese groups.
Table 1 presents the percentages regarding the subjects’
characteristics for the total, non-obese and obese groups. The
women in the age group of 45 to 65 years had a higher prevalence
of overweight (84.7%) and obesity (87.3%) compared to 76.6
and 82.9% of the men (Table 1). The results also show that
participants with no education tended to be more overweight
(71.1%) compared to those with qualifications, where women
were 76.4% overweight and 66.1% obese, in contrast to men
who were 63.3% overweight and 65.7% obese. The findings also
indicate that 83.5% of grounds maintenance employees were
overweight and 79.7% were obese in comparison to participants in
other occupations, where women showed a higher preponderance
of overweight (90.3%) and obesity (77.1%) compared to men
who were 73.5% overweight. Accounting clerks showed a higher
percentage of obesity (88.6%) within the obese category.
Presented in Table 2 are the means and standard deviations
for overweight and obesity for the total group and by gender. As
Fig. 1.
BMI categories for the total group and by gender.
Fig. 2.
Hypertension for the total group by gender and BMI categories
Table 1.
Subject characteristics of the men, women and total participants in the non-obese and obese groups
Non-obese group,
n
(%)
Obese group,
n
(%)
Total
Total participants
Men
Women
participants
Men
Women
OV
OB
OV
OB
OV
OB
Variables
Age group (years)
24–29
17 (9.6)
4 (3.3)
13 (23.6)
8 (7)
5 (3)
1 (2)
2 (5.7)
7 (9.7)
3 (2.5)
30–44
14 (7.9)
8 (6.5)
6 (10.9)
13 (11)
16 (11)
9 (18)
4 (11.4)
4 (5.6)
12 (10.2)
45–65
147 (82.6)
111 (90.2)
36 (65.5)
100 (83)
132 (86)
39 (76.6)
29 (82.9)
61 (84.7) 103 (87.3)
Qualification
No formal education
124 (69.7)
92 (74.8)
32 (58.2)
86 (71.1)
101 (10)
31 (63.3)
23 (65.7)
55 (76.4) 78 (66.1)
Std 8
8 (4.5) 8 (6.5)
8 (14.5)
4 (8.3)
10 (6.5)
2 (4.1)
4 (11.4)
2 (2.8)
6 (5.1)
Matric
20 (11.2)
12 (9.8)
10 (18.2)
7 (5.8)
18 (12)
3 (6.1)
2 (5.7)
4 (5.6)
16 (13.6)
Diploma
17 (9.6) 7 (5.7)
1 (1.8)
9 (7.4)
16 (10.5)
5 (10.2)
4 (11.4)
4 (5.6)
12 (10.2)
Degree
1 2 (1.1)
1 (0.8)
1 (1.8)
2 (1.7)
3 (2)
2 (4.1)
1
–
2 (1.7)
Degree
3 1 (0.6)
1 (0.8)
2 (3.6)
5 (4.1)
4 (2.6)
3 (6.1)
1
2 (2.8)
3 (2.5)
Degree 4
3 (1.7)
1 (0.8)
1 (1.8)
7 (5.8)
–
3 (6.1)
4 (5.6)
Certificate
2 (1.1)
1 (0.8)
–
1 (0.8)
1 (0.7)
–
1 (1.4)
1 (0.8)
Occupation
General clerk
12 (6.7)
11 (8.9)
1 (1.8)
11 (9.1)
18 (11.8)
8 (16.3)
4 (11.4)
3 (4.2)
14 (11.9)
Accounting clerk
3 (1.7)
1 (0.8)
2 (3.6)
2 (1.7)
7 (4.6)
1 (2.0)
31 (88.6)
1 (1.4)
7 (5.9)
Grounds maintenance workers
160 (89.9)
111 (90.2)
49 (89.1)
101 (83.5) 122 (79.1)
36 (73.5)
65 (90.3) 91 (77.1)
Municipality manager (MM)
1 (0.6)
–
1 (1.8)
6 (6)
2 (1.3)
4 (8.2)
2 (2.8)
2 (1.7)
Councillors
2 (1.1)
–
2 (3.6)
1 (1)
4 (2.6)
–
1 (1.4)
4 (3.4)
OV = overweight; OB = obese, Std 8 = Standard eight (grade 10).


