VOLUME 11 NUMBER 1 • MARCH 2014
15
SA JOURNAL OF DIABETES & VASCULAR DISEASE
REVIEW
Molecular basis of CVD
Insulin resistance plays an important role in the pathophysiology
of diabetes and CVD. Both genetic and environmental factors
facilitate its development. The development of CVD in people with
IR is characterised by early endothelial dysfunction and vascular
inflammation leading to monocyte recruitment, foam cell formation
and the subsequent development of fatty streaks.
1
Over many
years this leads to atherosclerotic plaque, which, in the presence of
enhanced inflammation, becomes unstable and ruptures to promote
occlusive thrombus production.
Atheroma from people with diabetes has more lipid,
inflammatory change and thrombus than those free of DM. These
changes occur over a 20- to 30-year period and are mirrored by
the molecular abnormalities seen in untreated insulin resistance
and DM.
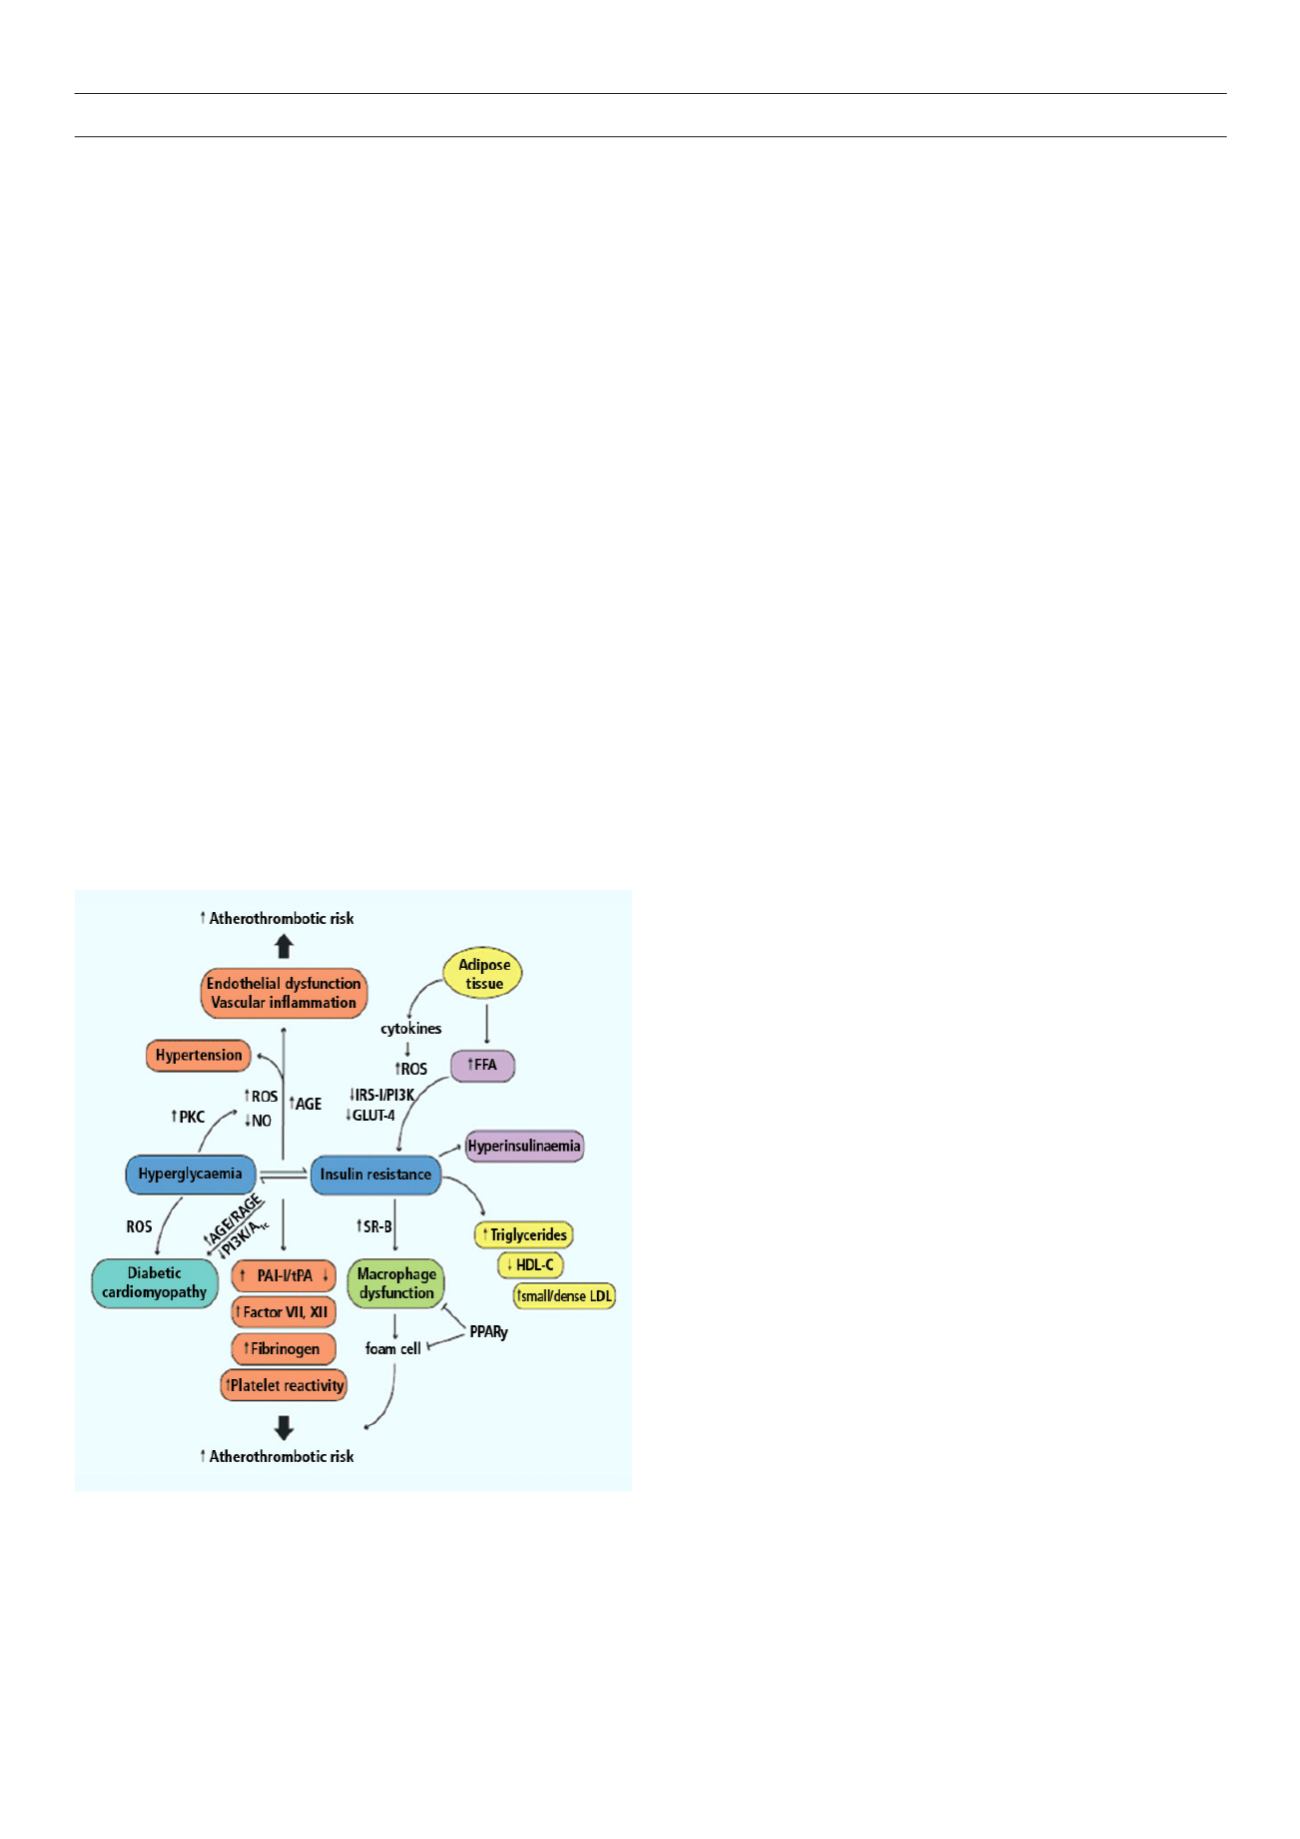
Type 2 DM patients are obese and the release of free fatty
acids (FFA) and cytokines from the adipose tissue directly impairs
insulin sensitivity in the skeletal muscles and adipose tissue. FFA
induce reactive oxygen species production, blunt activation of IRS
1 and P13K-AKT signalling, leading to down-regulation of insulin-
responsive glucose transporter 4 (GLUT 4) (Fig. 1).
Hyperglycaemia decreases nitric oxide bioavailability and affects
vascular function, involving over-production of reactive oxygen
species (ROS).
1
The mitochondrial electron transport chain is one
of the first targets of high glucose levels, with a direct increase
in superoxide anion formation. A further increase in superoxide
anion formation is driven by a vicious circle involving ROS-induced
activation of protein kinase C (PKC).
1
Mitochondrial ROS in turn
activates cascades involved in the pathogenesis of cardiovascular
complications, including polyol flux, advanced glycation end-
products (AGE) and AGE receptors (RAGE).
Hyperglycaemia-induced ROS generation is involved in the
persistence of vascular dysfunction despite normalisation of blood
glucose levels. This phenomenon is called metabolic memory,
which explains why vascular complications progress despite
intensive glycaemic control. Elevated ROS generation, despite
euglycaemic sensitivity, undermines the clinical gold standard of
indexing type 2 DM efficacy by blood glucose status.
Insulin-resistant macrophages increase the expression of
oxidised low-density lipoprotein (LDL) scavenger receptor-B,
promoting foam cell formation and atherosclerosis. Macrophage
dysfunction provides a crucial link between diabetes and CVD
both by enhancing it and contributing to the development of
fatty streaks and vascular damage.
Impact of glucose control on CVD and its
complications
Randomised, controlled trials provide compelling evidence that
microvascular complications of DM are reduced by tight glycaemic
control. However, the same cannot be said about macrovascular
disease. Several prospective trials have been conducted, which have
so far failed to provide any conclusive evidence of the superiority
of glycaemic control in reducing macrovascular complications or
death rates in people with advanced disease or those with a long
duration of diabetes.
Long-term effect of glycaemic control
The Diabetes Control and Complications Trial (DCCT) and
Epidemiology of Diabetes Interventions and Complications
(EDIC)
In DCCT, the rate of cardiovascular events was not significantly
altered in the intensive-treatment group of patients with type 1 DM.
2
After termination of the study, 93% of the cohort was followed for
an additional 11 years under EDIC, during which the differences in
HbA
1c
level disappeared. During the combined l7 years of follow up,
the risk of any cardiovascular event was reduced significantly in the
intensive-treatment group by 42% (9.63%,
p
< 0.1).
2
United Kingdom Prospective Diabetes Study (UKPDS)
In the UKPDS trial, 3 867 newly diagnosed subjects with type 2 DM
were randomised to an intensive glucose-control arm involving the
use of sulfonylurea or insulin, and a conventional arm employing
lifestyle management. A subgroup of overweight subjects were
included in the study that compared intensive glucose control with
metformin (
n
= 343) against conventional therapy (
n
= 411).
In the insulin and sulfonylurea group, a mean HbA
1c
level of
7% was achieved versus 7.9% in the control arm over 10 years.
Intensive control decreased relative risk for a composite endpoint
of all diabetes-related complications (RRR = 12%, p = 0.029), and
significantly improved microvascular disease risk (RRR = 25%,
p
= 0.01), whereas a trend towards decreased risk of myocardial
infarction (Ml) was observed with intensive-control group (14.8
vs 16.8%,
p
= 0.052, statistically not significant). Stroke was
numerically increased (5.6 vs 5.2%,
p
= 0.05). In overweight
subjects, metformin provided better glucose control (Alc > 7.4 vs
8%) as well as significantly improved risk for MI (RRR = 39%,
p
=
0.01) and for all-cause mortality (RRR = 26%
p
= 0.011).
Figure 1
. Pathophysiology of atherosclerosis in diabetes.
1
AGE: advanced gly-
cated end-products; FFA: free fatty acids; GLUT-4: glucose transporter 4; NO:
nitric oxide; PAI-1: plasminogen activator inhibitor 1; PKC: protein kinase C;
PPAR
γ
: peroxisome proliferator-activated receptor
γ
; PI3K: phoshphatidylinositide
3-kinase; RAGE: AGE receptor; ROS: reactive oxygen species; SR-B: scavenger
receptor B; tPA: tissue plasminogen activator.


