


 20 / 56

18
VOLUME 13 NUMBER 1 • JULY 2016
RESEARCH ARTICLE
SA JOURNAL OF DIABETES & VASCULAR DISEASE
Statistical analysis
Using SPSS 17.0, data were analysed and expressed as mean ±
standard deviation. Comparisons across the groups were done using
analysis of variance, and associations were verified by Spearman’s
correlation. Agreement between methods was assessed using
Bland and Altman plots of the difference against the means of the
two methods.
Results
Participants were 12 males and 12 females, aged 54 ± 15 years.
Their mean body mass index was 28.9 ± 5.8 kg/m
2
, mean systolic
and diastolic blood pressures were 128 ± 18 and 77 ± 8 mmHg,
respectively, and mean haemoglobin was 13.4 ± 1.8 g/dl. The
duration of diabetes in all patients was 10 ± 6 years with a pre-
inclusion HbA
1c
value of 7.8 ± 2.3%.
Overall, there was no statistically significant difference between
mean HbA
1c
measurements across the sites (Table 1). The correlation
between measurements varied from
r
= 0.89,
p
< 0.001 between
the 650-m/1 600-m altitudes,
r
= 0.92, p < 0.001 between the
13-m/650-m altitudes, to
r
= 0.96,
p
< 0.001 between 13-m/1
600-m altitudes. The coefficient of variation (CV) was 3.4% for the
650-m/13-m duplicates, 5.1% for 1 600-m/13-m duplicates and
3.2% for 1 600-m/650-m duplicates.
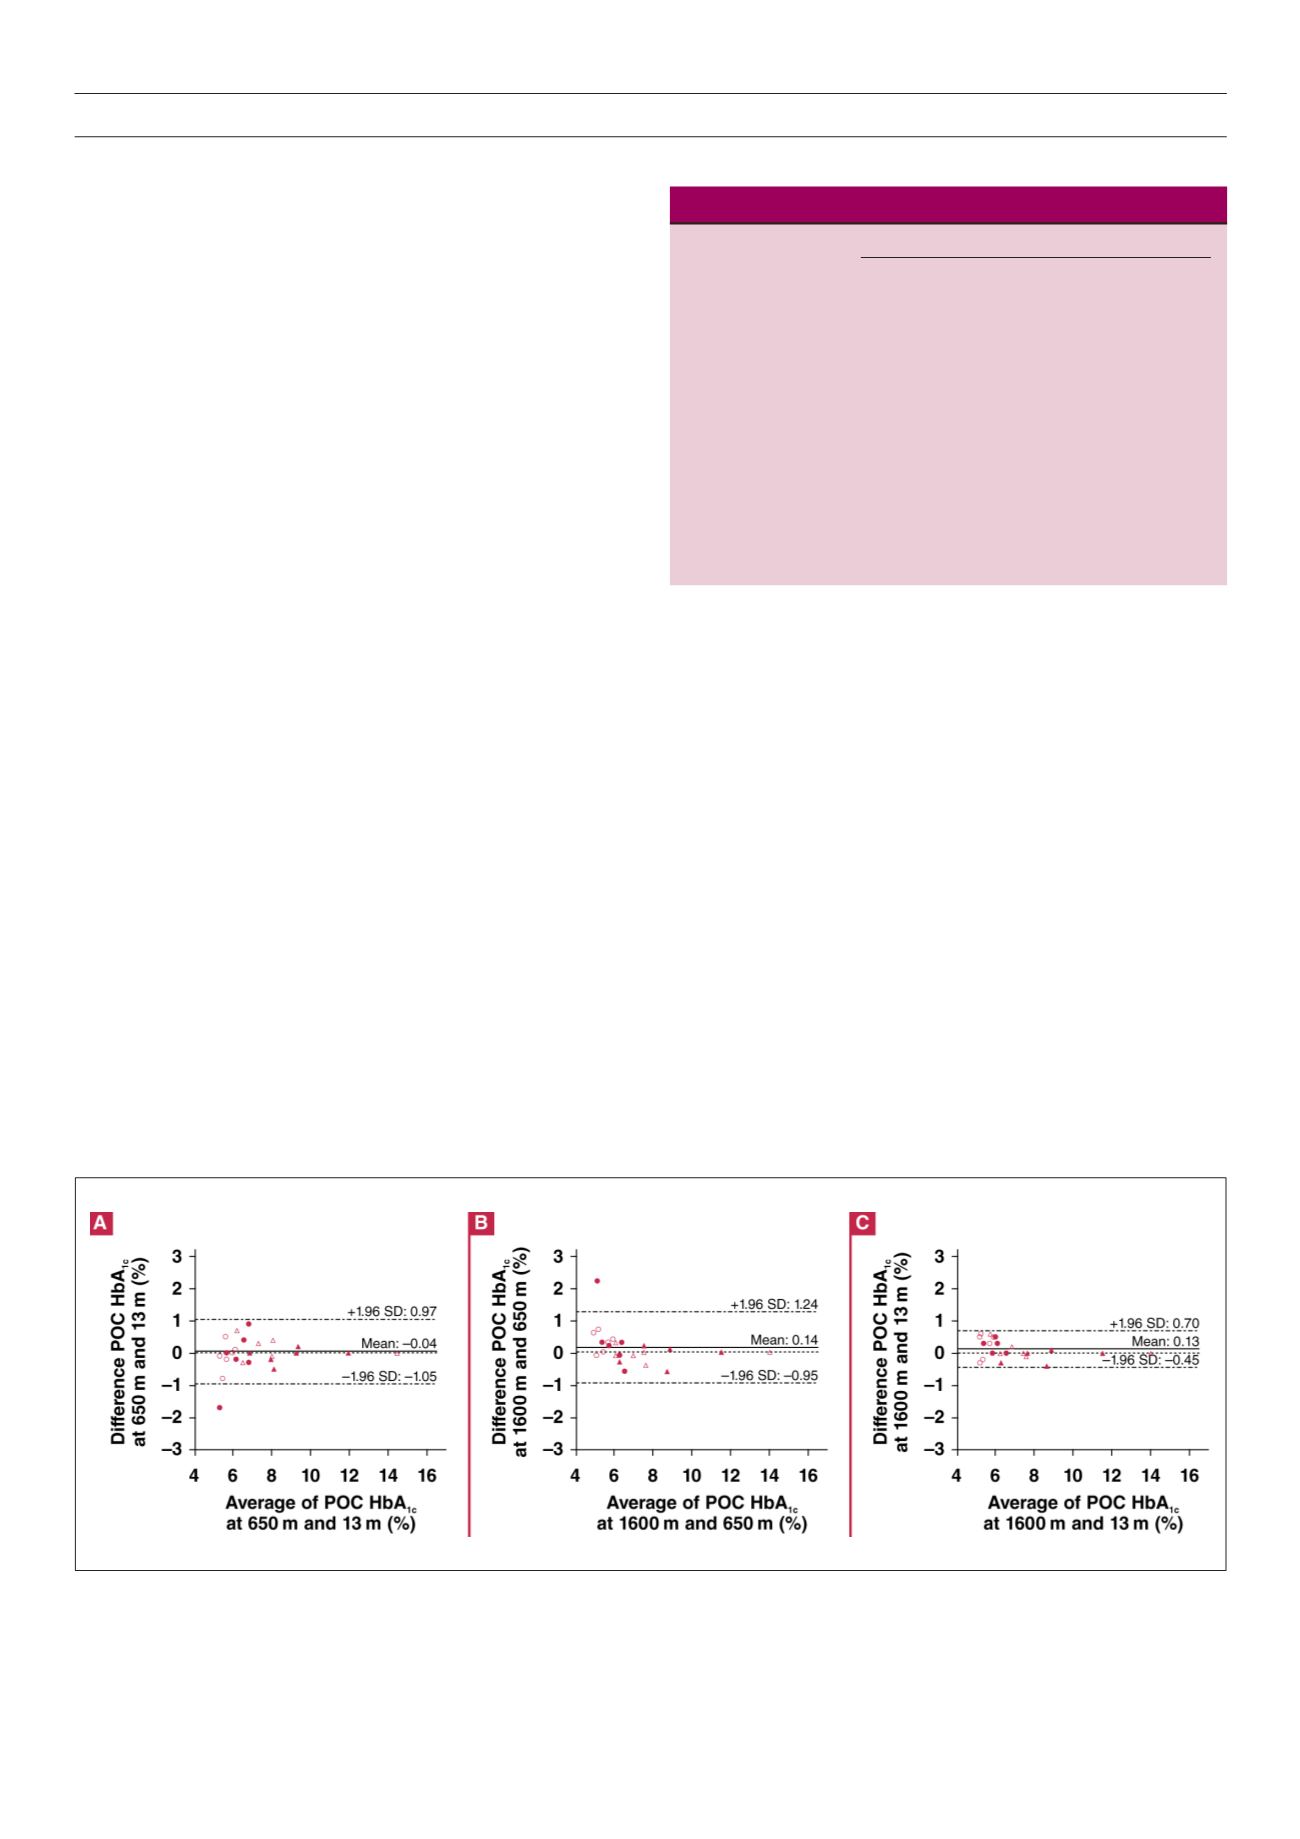
The mean differences expressed as estimates (95% CI) in
percentages between measurements at two different sites
were –0.04 (–1.05−0.97%), +0.14 (0.95−1.24%) and +0.13
(–0.45−0.70%), respectively, between the 650-m/13-m (Fig. 1A),
1 600-m/650-m (Fig. 1B), and 1 600-m/13-m altitudes (Fig. 1C).
The HbA
1c
differences were > 0.5% (8 mmol/mol) in 3/24 (12%)
between the 1 600-m/13-m measurements, 4/24 (17%) between
the 650-m/13-m measurements and in 6/24 (25%) between the
1 600-m/650-m measurements. In only one case associated with
more than one percentage difference across sites was a patient
with one of the readings at 4.2% (22 mmol/mol) in one site, which
normally would have prompted a second check. We did not find any
differences in the percentage variation of HbA
1c
levels at the low (
n
= 12), medium (
n
= 6) and high (
n
= 6) values for the different study
sites, namely 650-m/13-m (
p
= 0.453), 1 600-m/650-m (
p
= 0.111)
and 1 600-m/13-m altitudes (
p
= 0.344).
Table 1.
Comparison of mean HbA
1c
levels by group across the sites
Point-of-care In2it analyser
Study group Douala Yaounde Bamenda
p
-value
(13 m)
(650 m)
(1 600 m)
Healthy controls
5.0 ± 0.6 5.4 ± 0.3 5.6 ± 0.5 0.15
Patients with diabetes
HbA
1c
< 6.5% 5.9 ± 0.6 5.7 ± 0.6 5.9 ± 0.4 0.29
(< 49 mmol/mol)
HbA
1c
6.5–8.0% 8.1 ± 3.0 7.9 ± 3.1 8.0 ± 3.0 0.66
(49–64 mmol/mol)
HbA
1c
> 8.0% 8.4 ± 1.8 8.5 ± 1.7 9.0 ± 2.2 0.84
(> 64 mmol/mol)
All study participants 6.8 ± 2.2 6.9 ± 2.2 7.1 ± 2.3 0.31
Discussion
This study indicates that the POC analyser showed no significant
differences across Cameroonian sites located at altitudes varying
from 13 to 1 600 m (≤ 0.5% in 75% of comparisons). Although
measurements were not repeated in each site to reflect clinical
practice, our results suggest a test reliability of the In2it POC
instrument below 1 600 m.
Interestingly, previous studies in which the device calibration was
performed with HPLC, had suggested satisfactory external validity.
7
This was however not investigated in our study and therefore
represents a major limitation with the sample size.
However, considering our findings and the cut-off value of 3.5%
of CV for optimal performance between laboratories (between
study sites in our case), one could say that although no significant
difference was observed between HbA
1c
levels at the three altitudes,
the POC apparatus had a relatively high variability between 13 and
1 600 m.
8
As expected, this variability was higher in low and normal
HbA
1c
levels (not shown).
In this regard, the use of the POC HbA
1c
analyser could be more
indicated for the monitoring of patients with a view to comparing
Figure 1.
Plots of the differences against averages of POC HbA
1c
levels at 13-m and 650-m altitudes (A), 1 600-m and 650-m altitudes (B), and a1 600-m and 13-m
altitudes (C), with mean difference (bias) and 95% agreement limits.