


 25 / 56

VOLUME 13 NUMBER 1 • JULY 2016
23
SA JOURNAL OF DIABETES & VASCULAR DISEASE
RESEARCH ARTICLE
parameters according to gender. Men had significantly higher mean
absolute QT intervals (374 ± 35.0 vs 348 ± 45.5 ms,
p
= 0.006),
left atrial area (28.8 ± 8.8 vs 25.0 ± 6.4 cm
2
,
p
= 0.010), LV internal
dimension in systole, as well as absolute and indexed LV mass (
p
=
0.001, 0.026 and 0.016, respectively). On the other, hand women
had significantly higher ejection fractions (45.1 ± 20.1 vs 40.6 ±
23.6,
p
= 0.007).
The mean length of hospital stay was 10.5 ± 5.9 days, (11.0 ± 5.4
and 10.0 ± 6.3 days for women and men, respectively). Mortality
rate at 30 days was 4.2% (95% CI: 2.4–7.3) for the whole cohort. It
Table 4.
Clinical and demographic predictors of outcome on univariate analysis (six-month survival).
Variable
All (
n
= 285)
Alive (258)
Dead (23)
OR
95% CI
Age (years)
57.3 ± 15.4
57.4 ± 14.0
57.2 ± 19.1
0.99
0.96–1.01
Female gender (%)
52.6
54.5
50
1.14
0.48–2.70
No education (%)
33.3
32.8
30.0
0.77
0.26–2.28
Not married (single) (%)
67.8
69.6
52.9
1.51
0.56–4.07
Body mass index
24.0 ± 5.4
23.7 ± 4.9
23.4 ± 3.6
0.97
0.87–1.08
Non-smoker (%)
81.8
82.3
85.0
1.51
0.43–5.34
Alcohol use (%)
6.0
5.6
5.0
0.79
0.32–1.95
Presence of diabetes (%)
13.0
13.1
10.0
0.65
0.14–2.92
Respiratory rate (bpm)
28.3 ± 6.2
28.0 ± 6.6
29.2 ± 5.3
1.02
0.96–1.08
Heart rate (bpm)
95.5 ± 17.1
95.0 ± 17.4
100.5 ± 15.9
1.00
0.97–1.03
Systolic blood pressure (mmHg)
136.1 ± 29.4
137.3 ± 27.7
122.5 ± 20.0
0.98
0.96–6.99
Diastolic blood pressure (mmHg)
87.1 ± 29.4
88.6 ± 18.7
80.0 ± 13.4
0.98
0.95–1.00
Pulse pressure > 30 mmHg (%)
3.3
2.1
5.0
0.42
0.16–1.10
NYHA (III and IV) (%)
91.5
90.4
95.0
4.03
1.53–10.65
Serum sodium (mmol/l)
136.9 ± 4.6
136.0 ± 6.4
137.2 ± 7.4
1.03
0.96–1.11
Serum potassium (mmol/l)
3.7 ± 0.5
3.6 ± 0.7
4.0 ± 1.0
1.64
0.72–3.75
Blood glucose (mg/dl)
112.3 ± 56.0
117.0 ± 58.5
111.8 ± 58.5
1.00
0.99–1.01
(mmol/l) (6.23 ± 3.11)
(6.49 ± 3.25)
(6.20 ± 3.25)
Packed cell volume (%)
41.0 ± 7.6
37.6 ± 7.0
32.2 ± 8.4
0.92
0.86–0.97
Total white blood cell count
6.8 ± 3.1
6.9 ± 3.4
9.2 ± 5.1
1.13
1.02–1.25
Serum creatinine (mg/dl)
0.8 ± 0.3
1.2 ± 1.0
2.1 ± 2.5
1.38
1.04–1.83
(µmol/l) (70.72 ± 26.52)
(106.08 ± 88.40)
(185.64 ± 221.00)
QRS duration (ms)
107.1 ± 9.4
110.3 ± 29.5
110.9 ± 32.2
1.01
0.99–1.03
Corrected QT (ms)
439.4 ± 40.9
449.3 ± 34.4
457.3 ± 34.6
1.01
0.99–1.04
Atrial fibrillation (%)
13.3
14.6
20.0
1.14
0.36–3.55
E/A ratio
2.2 ± 1.0
2.1 ± 1.3
2.7 ± 1.6
1.40
0.99–1.97
Left atrial area (cm
2
)
26.2 ± 6.7
26.8 ± 7.5
34.2 ± 12.1
1.11
1.01–1.21
Left atrial diameter (cm)
4.8 ± 0.9
4.6 ± 0.9
5.0 ± 1.1
1.56
0.94–2.60
LVID (cm)
5.47 ± 1.55
5.6 ± 1.5
5.7 ± 1.2
1.11
0.74–1.67
HF with systolic dysfunction
66.4
67.5
70.6
0.66
0.27–1.59
MR (yes) (%)
19.6
20.2%
25.0
1.34
0.50–3.60
TR (yes) (%)
15.1
13.1%
35.0
2.64
1.00–6.95
LVID = left ventricular internal diameter, MR = mitral regurgitation, TR = tricuspid regurgitation.
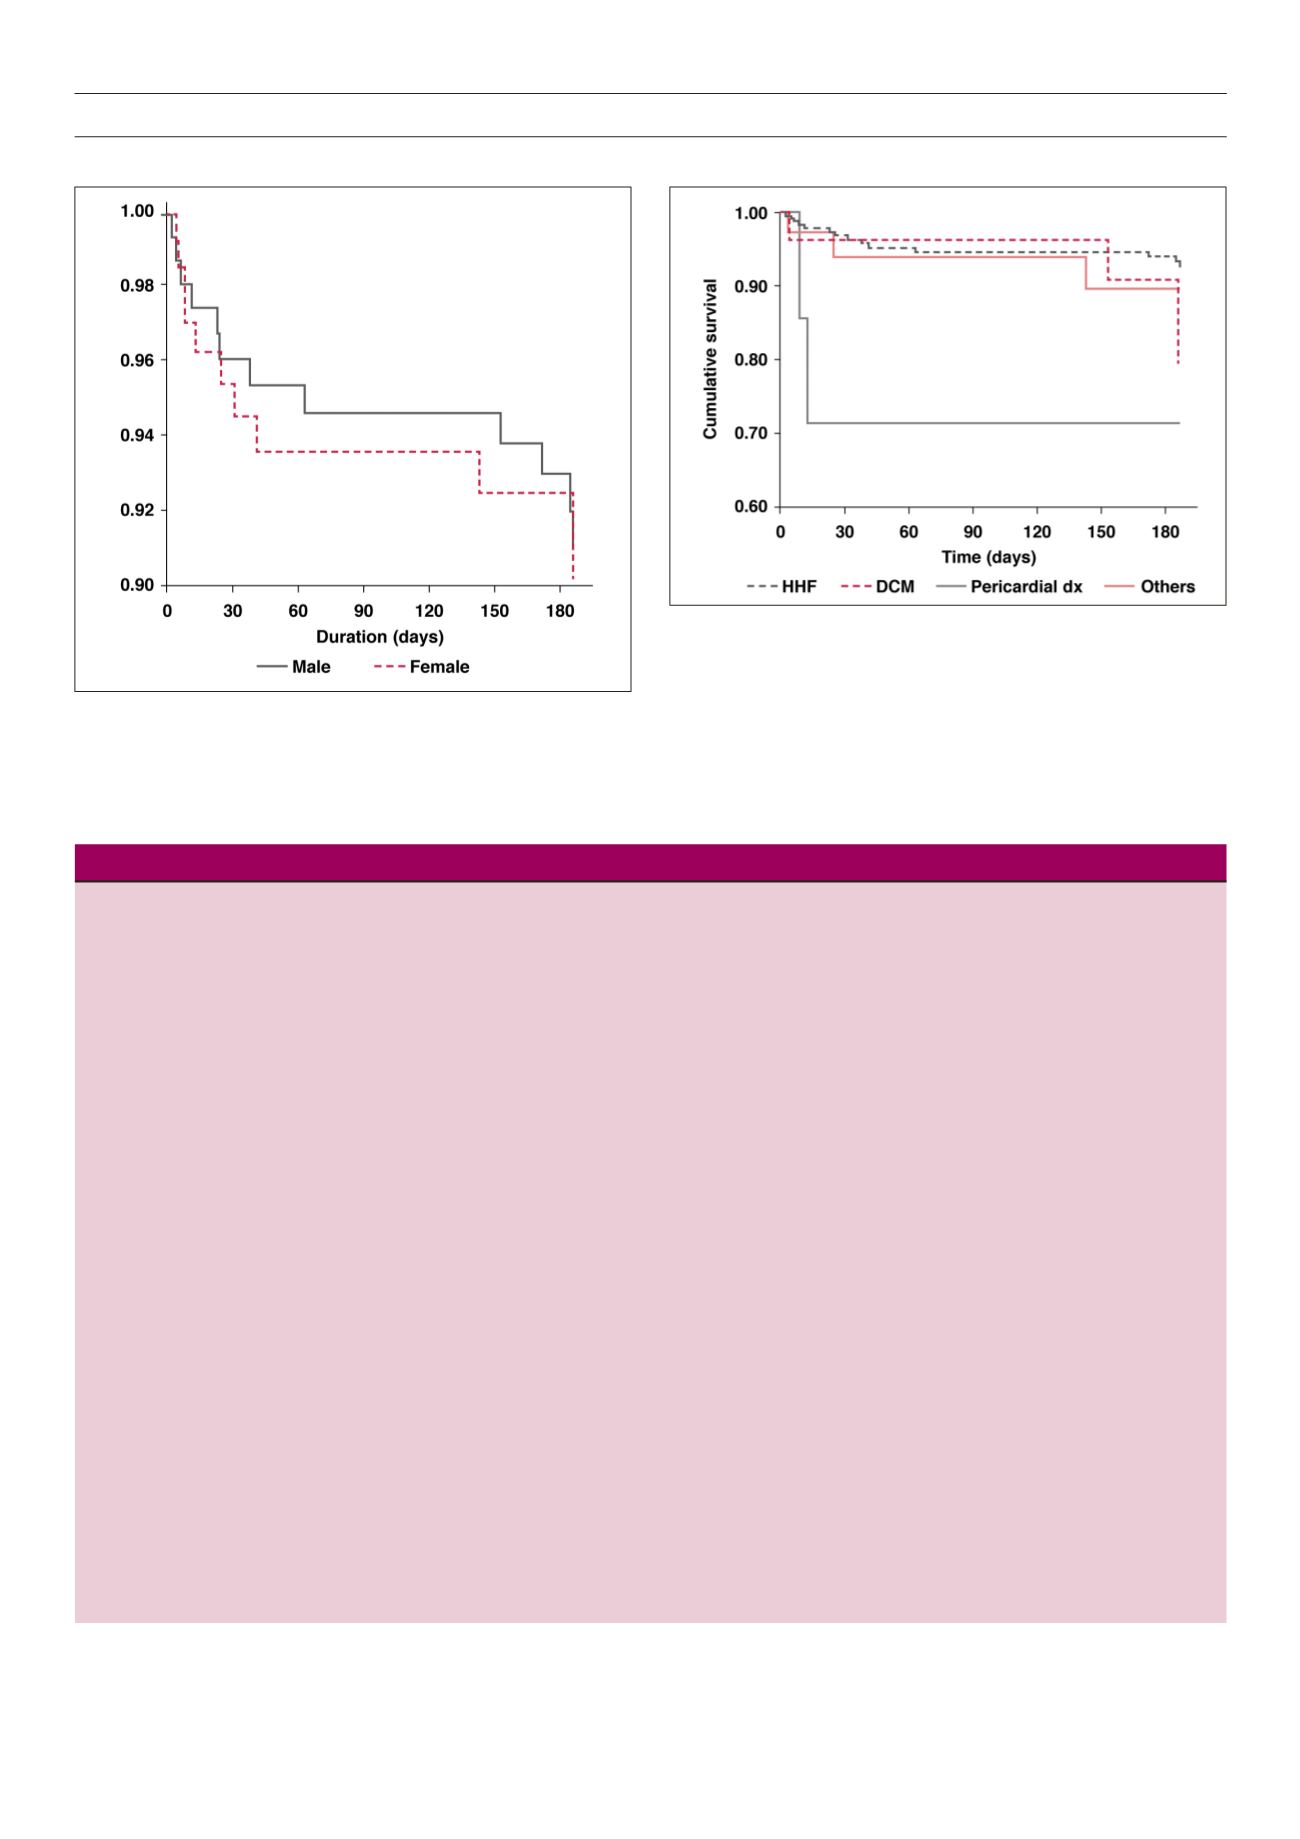
Figure 3.
Kaplan–Meier survival curve for the different aetiological risk factors.
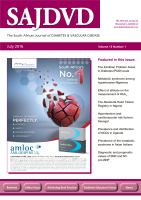
Figure 2.
Kaplan–Meier survival curve for males and females.