


 23 / 56

VOLUME 13 NUMBER 1 • JULY 2016
21
SA JOURNAL OF DIABETES & VASCULAR DISEASE
RESEARCH ARTICLE
The main objective of the registry was to characterise the current
profile of HF in the community. It was also aimed at determining the
mode of care as well as intra-hospital and six-month outcomes.
Clinical information relating to the socio-demography, medical
history, signs and symptoms, medications, results of laboratory
investigations, including 12-lead ECG and echocardiography,
were collected. A standardised case report form was used for data
collection. Home addresses and telephone contacts of the subjects
as well as their next of kin were also recorded.
Subjects were weighed without shoes and in light clothing using
a standard beam balance. An anthropometric plane was used for
height measurement to the nearest centimetre. Body mass index
(BMI) was calculated using the standard formula. Blood pressure
measurements were done according to international guidelines,
15
with the use of a mercury sphygmomanometer (Accousson,
London).
We defined anaemia as haematocrit of less than 10 g/dl. The
modification of diet in renal disease (MDRD) formula was used for
the estimation of glomerular filtration rate (GFR).
16
An estimated
GFR (eGFR) of less than 60 ml/min/1.73 m
2
was the criterion used
for defining renal dysfunction.
4
A clinical diagnosis of HF was based on the Framingham criteria.
17
Using the recent guidelines of the European Society of Cardiology,
18
subjects were categorised into de novo presentation, as well as
recurrent presentation of typically decompensated HF (i.e. acute-
on-chronic HF).
Standard 12-lead resting ECGs were recorded for each patient
using a Schiller ECG machine (Schiller AG, Switzerland). All the
12-lead resting ECGs were performed by trained nurses/technicians
and analysed by a reviewer who was blinded to the clinical data of
the patients.
Echocardiography was performed on the subjects with the use
of an Aloka SSD – 4000 echocardiography (Aloka Co Ltd, Tokyo,
Japan). Standard views and two-dimensional guided M-mode
measurements were obtained according to international guidelines.
Aortic root and left atrial diameter, left ventricular (LV) internal
dimensions and wall thicknesses were obtained according to the
American Society of Echocardiography (ASE) criteria. Measurements
were obtained in up to three cycles and averaged. One experienced
cardiologist (OSO) performed all the procedures.
In our laboratory, the intra-observer concordance correlation
coefficient and measurement errors have been reported.
19
The
Devereux and Recheck formula was used for LV mass calculation.
20
Increased relative wall thickness (RWT) was defined as RWT >
0.43.
21
Impaired LV systolic function was defined as LV ejection fraction
of < 50%. Transmitral flow velocities, deceleration time and
isovolumic relation time were obtained using standard methods.
22
Tissue Doppler imaging (TDI) was applied only to identify true
pseudo-normalised filling pattern.
The cohort was prospectively followed up for six months. The
mean follow-up period was 205 days. Subjects were contacted
via clinic visits or telephone calls at one month, three months and
six months. Follow-up data included their wellbeing, medications,
history of rehospitalisation and deaths (from next of kin). In addition
to patient or relative telephone interviews, where necessary,
referring physicians were contacted for additional information.
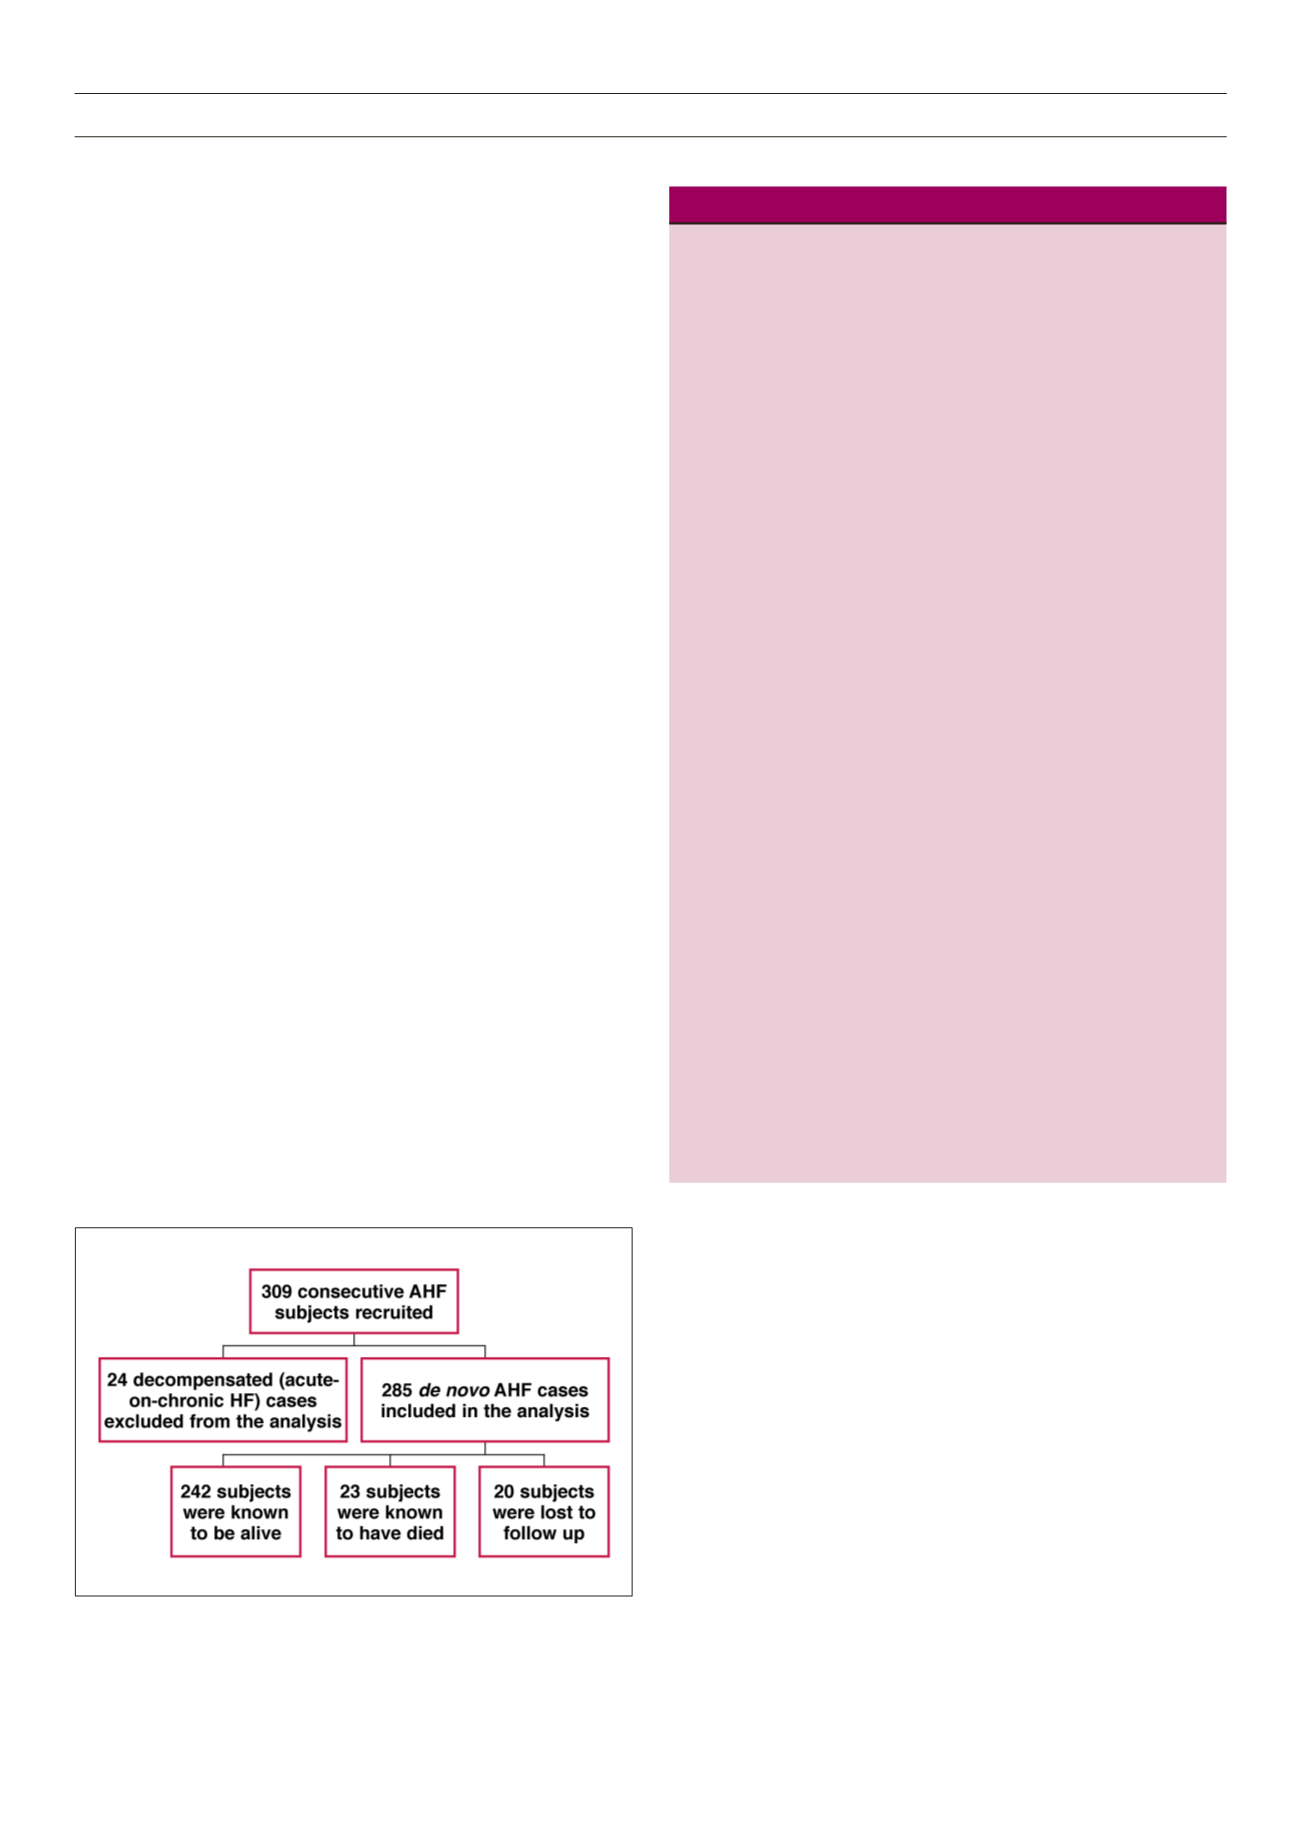
Fig. 1 is a flow chart showing the recruitment and follow up of the
study cohort.
Table 1.
Demographic and clinical profile characteristics of the cohort.
All
Men
Women
Variable (
n
= 285) (
n
= 150) (
n
= 135)
p
-value
Socio-demographic
variables
Age (years)
60.0 ± 13.2 57.0 (13.6) 55.6 (17.3) 0.382
Age > 60 years (%)
46.3
48.7
43.7 0.425
No education
98 (34.4)
39 (26.0)
59 (43.7) 0.028
Married (%)
156 (67.8)
92 (73.0)
64 (61.0) 0.014
Unemployed
7 (2.3)
1 (0.6)
6 (4.2)
0.007
Urban residence
216 (75.8)
113 (75.3)
103 (76.5) 0.389
Risk factors and
co-morbidities
Never smoked
cigarettes
233 (81.8)
103 (68.7)
103 (96.3) < 0.001
Current alcohol use
17 (6.0)
14 (9.3)
3 (2.2)
< 0.001
Diabetes mellitus
37 (13.0)
19 (12.7)
18 (13.3) 0.735
Hypertension
232 (81.4)
128 (85.3)
134 (77) 0.103
COPD
20 (7.0)
11 (7.3)
9 (6.7)
0.923
Family history of
heart disease
25 (8.8)
9 (6.0)
16 (11.9) 0.240
Clinical/laboratory
parameters
NYHA class
Class II
24 (8.4)
16 (10.7)
8 (5.9)
0.212
Class III
215 (75.4)
107 (71.3)
108 (80.0)
Class IV
46 (16.1)
27 (18.0)
19 (14.1)
BMI (kg/m
2
)
25.2 ± 5.7 24.1 (5.0)
23.7 (5.5) 0.527
Systolic BP (mmHg)
131.9 ± 25.1 137.9 (30.0) 133.3 (27.9) 0.253
Diastolic BP (mmHg)
85.4 ± 15.9 89.0 (19.6) 85.3 (17.1) 0.156
Pulse pressure (mmHg)
46.5 ± 15.7 49.0 (19.0) 47.7 (16.6) 0.527
Respiratory rate
(cycles/min)
30.2 ± 6.5 28.5 ± 6.4 27.9 ± 6.7 0.541
Pulse rate (bpm)
95.9 ± 16.7 96.2 ± 18.2 96.3 ± 17.8 0.527
Packed cell volume (%)
35.9 ± 7.8 37.5 ± 7.2 36.8 ± 7.7 0.541
Total white blood cell
count (×109 cells/l)
6.4 ± 2.9 7.3 ± 3.7 7.4 ± 3.8 0.933
Serum sodium (mmol/l)
136.5 ± 6.4 135.9 ± 6.7 136.3 ± 6.1 0.134
Serum potassium (mmol/l) 3.7 ± 0.8 3.7 ± 0.8 3.6 ± 0.8 0.461
Total cholesterol (mg/dl) 162.5 ± 53.3 157.7 ± 84.0 181.2 ± 64.6 0.213
Serum glucose (mg/dl)
111.7 ± 53.2 115.6 ± 50.6 114.0 ± 58.5 0.845
Serum urea (mg/dl)* 38.5 ± 30.0 50.5 ± 51.4 36.1 ± 29.7 0.020
Serum creatinine (mg/dl)* 1.8 ± 0.4 1.7 ± 2.5 1.2 ± 1.4 0.093
COPD = chronic obstructive pulmonary disease.
Figure 1.
Flow chart showing the recruitment of the subjects.