


 30 / 56

28
VOLUME 13 NUMBER 1 • JULY 2016
RESEARCH ARTICLE
SA JOURNAL OF DIABETES & VASCULAR DISEASE
were invited to participate in the study. One hundred and twenty
households were randomly selected, giving a total of 1 424
participants; 32 sets of data were not been analysed because of
missing biological and/or clinical data.
Eligible criteria were age ≥ 15 years and being a resident of
Saint Louis. Formal written consent was obtained. Non-consenting
patients and pregnant women were not included.
Participants were involved in the survey for one day. Those with
abnormal physical or laboratory findings were counselled and
referred to the regional hospital as defined by the National Health
reference system. Interviews, body measurements and laboratory
tests were performed by nurses and clinical officers.
The survey questionnaire consisted of socio-demographic (age,
gender, education, marital status), lifestyle (fruit and legumes
consumption, exposure to tobacco and alcohol, and physical
activity) variables, and medical and health history.
Physical bodymeasurements included blood pressure (BP), height,
weight, and waist circumference. Blood pressure measurements
were taken using an electronic digital blood pressure machine
(OMRON
®
M6). Three BP measurements were performed on both
arms, in a seated position, legs uncrossed, after a five- to 10-minute
rest. The highest BP value was recorded.
Waist circumference was measured in centimeters using a tape
measure, and the measurement was made at the mid-axillary line,
midway between the last rib and the superior iliac crest. Height was
measured with the participant standing upright against a wall on
which a height mark was made. Weight measurements were taken
on a pre-calibrated weighing scale (Seca 750). Participants were
weighed dressed in light clothing and barefoot.
Blood samples were analysed in a single laboratory using an
automateReflotron-Plus
®
.Cholesterol[total,high-densitylipoprotein
(HDL) and low-density lipoprotein (LDL)], triglyceride, fasting blood
glucose, uric acid and creatinine levels were analysed.
Hypertension was defined as a systolic BP ≥ 140 mmHg or
a diastolic BP ≥ 90 mmHg, or a documented medical history of
antihypertensive treatment.
7
Obesity was defined as body mass
index (BMI) ≥ 30.0 kg/m
2
, and overweight by a BMI > 25 but < 30
kg/m
2
.
Diabetes mellitus was defined as two fasting blood glucose
levels > 1.26 g/l and/or a documented medical history of diabetes
or diabetes treatment. The threshold for normal values were < 2g/l
for total cholesterol, < 1.6 g/l for LDL cholesterol, > 0.4 g/l for HDL
cholesterol, and < 1.5 g/l for fasting triglycerides.
Table 2.
Prevalence of cardiovascular risk factors in the studied
population (
n
= 1 424)
Risk factors
Prevalence, % (95% CI)
Hypertension
46 (43.4–48.6)
Abdominal obesity
33.2 (30.8–35.7)
Obesity (BMI > 30 kg/m
2
)
23 (18.1–28.2)
Tobacco smokers
5.8 (4.7–7.2)
Physical inactivity
44.4 (40.2–49)
Diabetes
10.4 (8.9–12.1)
Raised cholesterol ( > 2 g/l ) (> 5 mmol/l)
36.3 (33.8–38.9)
Raised LDL cholesterol ( > 1.6 g/l ) (> 4.14 mmol/l) 20.6 (18.5–22.8)
Low value of HDL cholesterol
41.9 (39.4–44.5)
Metabolic syndrome
15.8 (14–17.8)
BMI: body mass index, CI: confidence interval.
Physical inactivity was defined as the absence of daily physical
activity or the presence of physical activity lasting less at 150
minutes per week. Abdominal obesity was defined according to
NCEP, with a waist circumference greater than 102 cm in men and
88 cm in women.
Ethics committee approval to undertake the survey was in
accordance with national and local regulations. Written, signed
consent was obtained for each of the patients included. The study
was conducted in accordance with the Helsinki II Declaration.
Statistical analysis
Data recorded in the standard questionnaire were double checked
by external monitor and double-entered using Epi Data software.
Entered data were cleaned and analysed by an experienced
biostatistician using Epi info version 3.5.1 software.
Binary variables were described by their proportion and
continuous variables by means and standard deviation (SD).
Pearson and Yates (when appropriate) chi-square test were used
for the comparison of qualitative variables and Student’s
t
-test
for the comparison of quantitative variables between groups. A
logistic regression model was built with variables associated with
hypertension. Age and gender were forced into the final model.
The results were statistically significant if
p
< 0.05.
Results
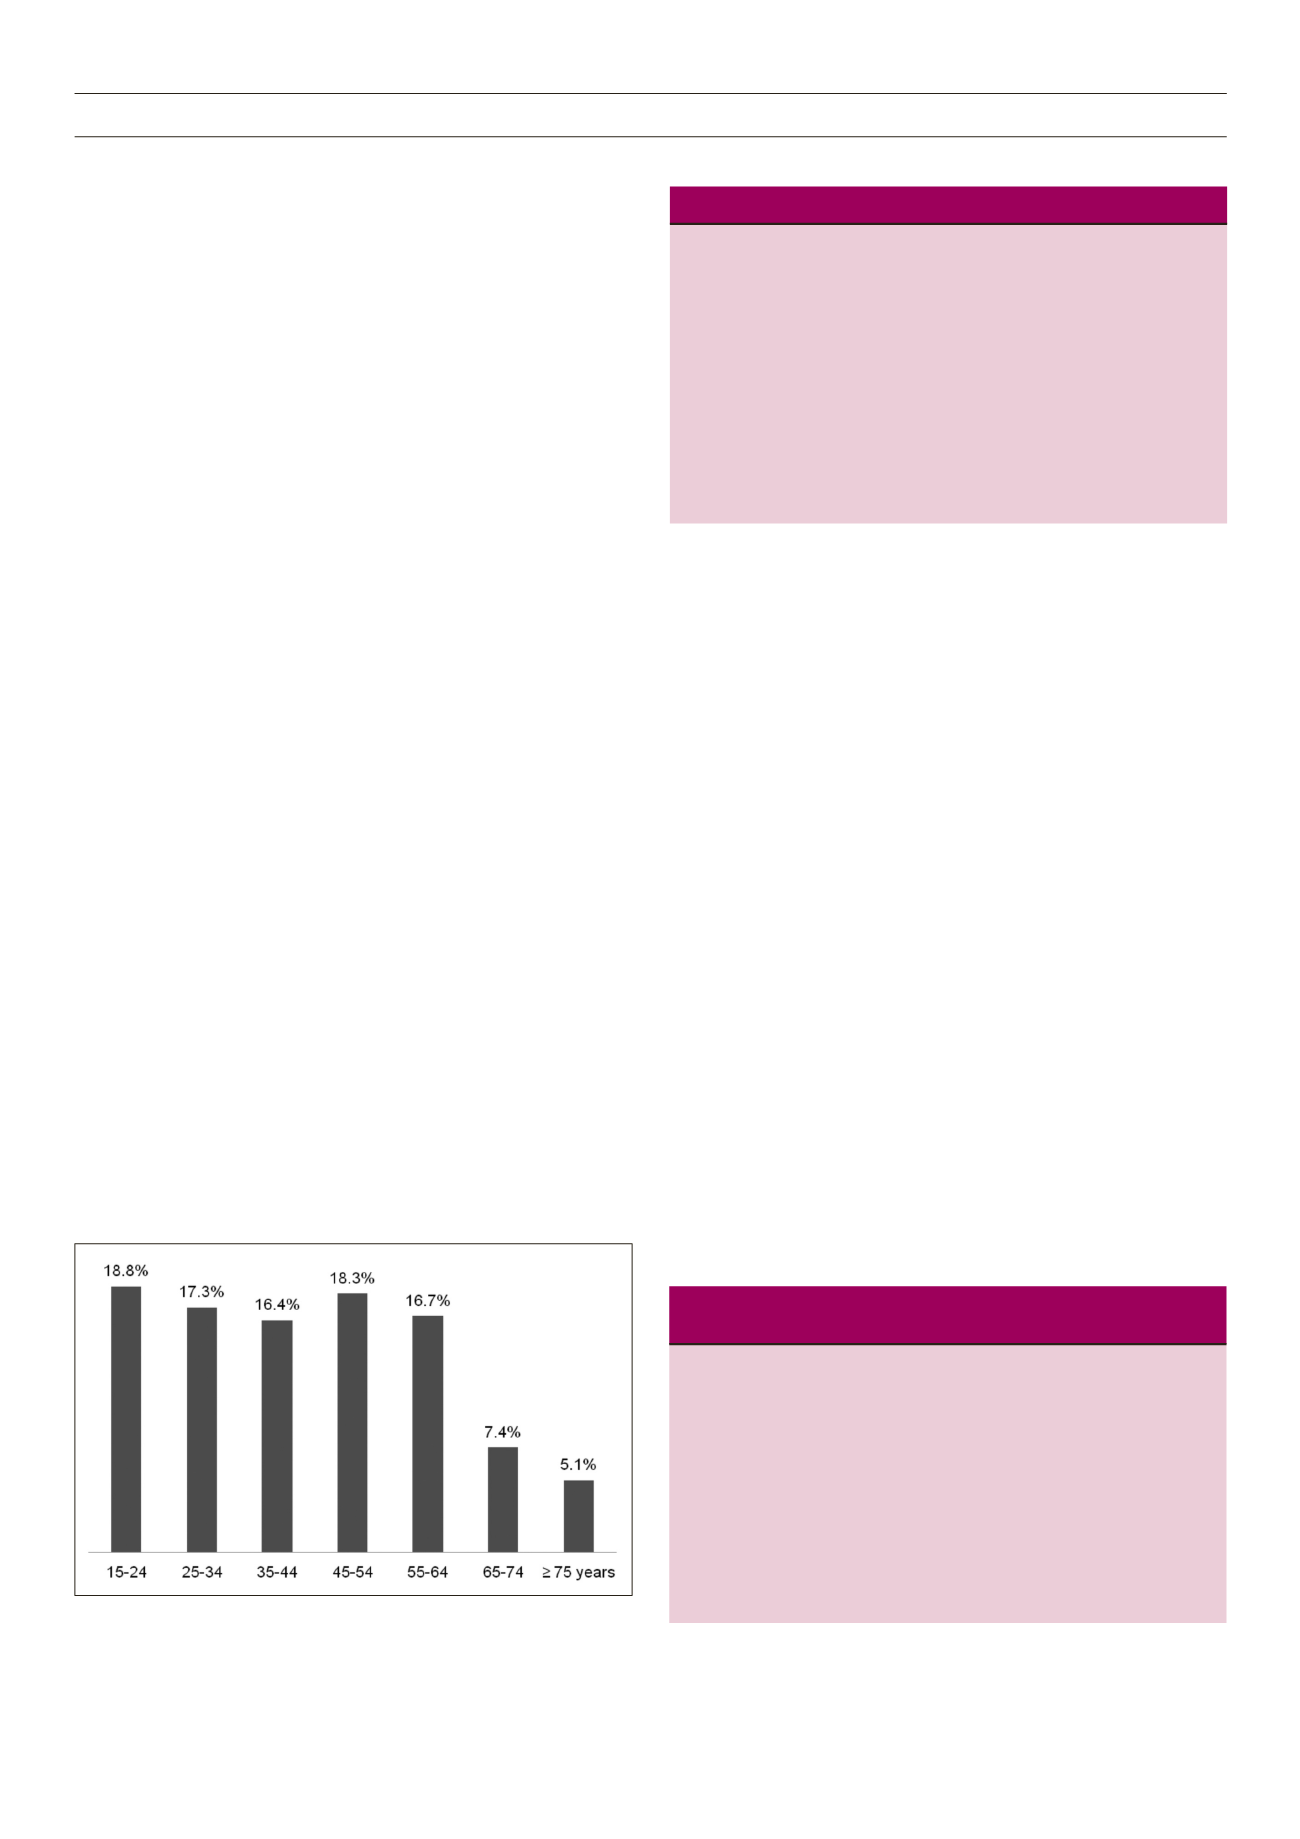
We recruited 1 424 participants (983 female, 69%). Mean age
was 43.4 years (SD: 17.8), (range 15–96 years); 70.8% were < 55
years and 87.5% were < 65 years. Fig. 1 shows the distribution
of the population by age. Table 1 shows the characteristics of the
Table 1.
Characteristics of the study population (
n
= 1 424)
Female
Male
Total
p
Sample size
983
441
1424
Age (years), mean (SD)
44.2 (17.2)
41.7 (18.9)
43.4 (7.8)
0.016
Weight (kg), mean (SD)
71.7 (17.9)
67.6 (13.6) 70.5 (16.7) < 0.001
Height (cm), mean (SD) 163.3 (8.3)
174.9 (8.5)
166 (9.9)
< 0.001
Waist circumference (cm),
mean (SD)
87.4 (16.5)
81.2 (46.8) 84.6 (15.9) 0.0003
Systolic BP (mmHg),
mean (SD)
131.1 (28.7) 131.9 (22.3) 131.2 (27.8) 0.893
Diastolic BP (mmHg),
mean (SD)
86.7 (24.5)
82.4 (22.4) 85.4 (22.4) 0.0001
BMI (kg/m
2
), mean (SD)
27 (7.2)
22.1 (16.2)
25.5 (6.7) < 0.001
SD: standard deviation
Figure 1.
Distribution of study population by age (
n
= 1424).