


 31 / 56

VOLUME 13 NUMBER 1 • JULY 2016
29
SA JOURNAL OF DIABETES & VASCULAR DISEASE
RESEARCH ARTICLE
enrolled population and Table 2 shows the prevalence of various
cardiovascular risk factors.
Six hundred and fifty-five participants had HTN, giving a
prevalence of 46.0% (95% confidence interval: 43.4–48.6%).
Among these 655 cases, 327 (50%) were previously undiagnosed.
HTN was more frequent in females [47.9% (44.8–51.1%)] than in
males [41.7% (37.1–46.5%),
p
= 0.015, OR = 1.29 (1.02–1.62)]. The
mean age was significantly higher in the hypertensive participants
(53.6, SD: 15.8 years) than in non-hypertensive participants (34.7
years, SD: 14.5,
p
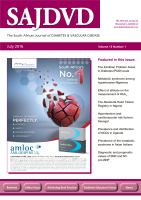
< 0.001). The prevalence of HTN increased with
age (
p
= 0.001) (Fig. 2). Mean duration of HTN was 6.9 years (range:
1 month – 60 years).
Among HTN participants, mean systolic BP was 136 mmHg and
mean diastolic BP 88 mmHg. Grade 1 HTN was more frequent
(48%) than grade II (25%) and grade III (27%). HTN tended to
be more frequent in participants who had primary school level
education (42.1%) than in those who had higher levels of education
(28.4%,
p
= 0.18). Table 3 shows the distribution of hypertension
according to socio-professional category. There was a statistically
significant relationship between hypertension and the different
socio-professional categories, except for self-employed, privately
employed and voluntary participants (
p
= 0.0031).
Diabeteswas detected in 16.5% (13.8–19.6%) of the participants
with HTN and in 5.2% (3.8–7.1%) of participants without HTN [
p
=
0.023, OR = 0.32 (0.21–0.47)]. Moreover, HTN was more frequent
in participants with diabetes [73% (65.1–79.9%)] than in those
without diabetes [43% (40.1–45.6%),
p
< 0.0001, OR = 3.59
(2.46–5.25)].
Other risk factors associated with HTN were dyslipidaemia in
71.1% (67.5–74.6%) of participants with HTN versus 59% (55.5–
62.5%) in non-HTN participants (
p
< 0.001), physical inactivity
[48.5% (43.9–52.1%) vs 40.2% (36.3–44.5%),
p
< 0.001] and
abdominal obesity [47.3% (43.5–51.2%) vs 21.2% (18.4–24.3%),
p
< 0.001].
HTN was more frequent in the case of a past history of smoking
(50.8%) (41.8–59.7%) than in passive exposure (44.8%) (40.9–
48.8%) and cigarette users (33.7%) (23.7–44.9%). A medical
history of stroke was more frequent in participants with HTN (2.7%)
(1.7–4.4%) compared with those without HTN (0.5%) (0.2–1.4%)
(
p
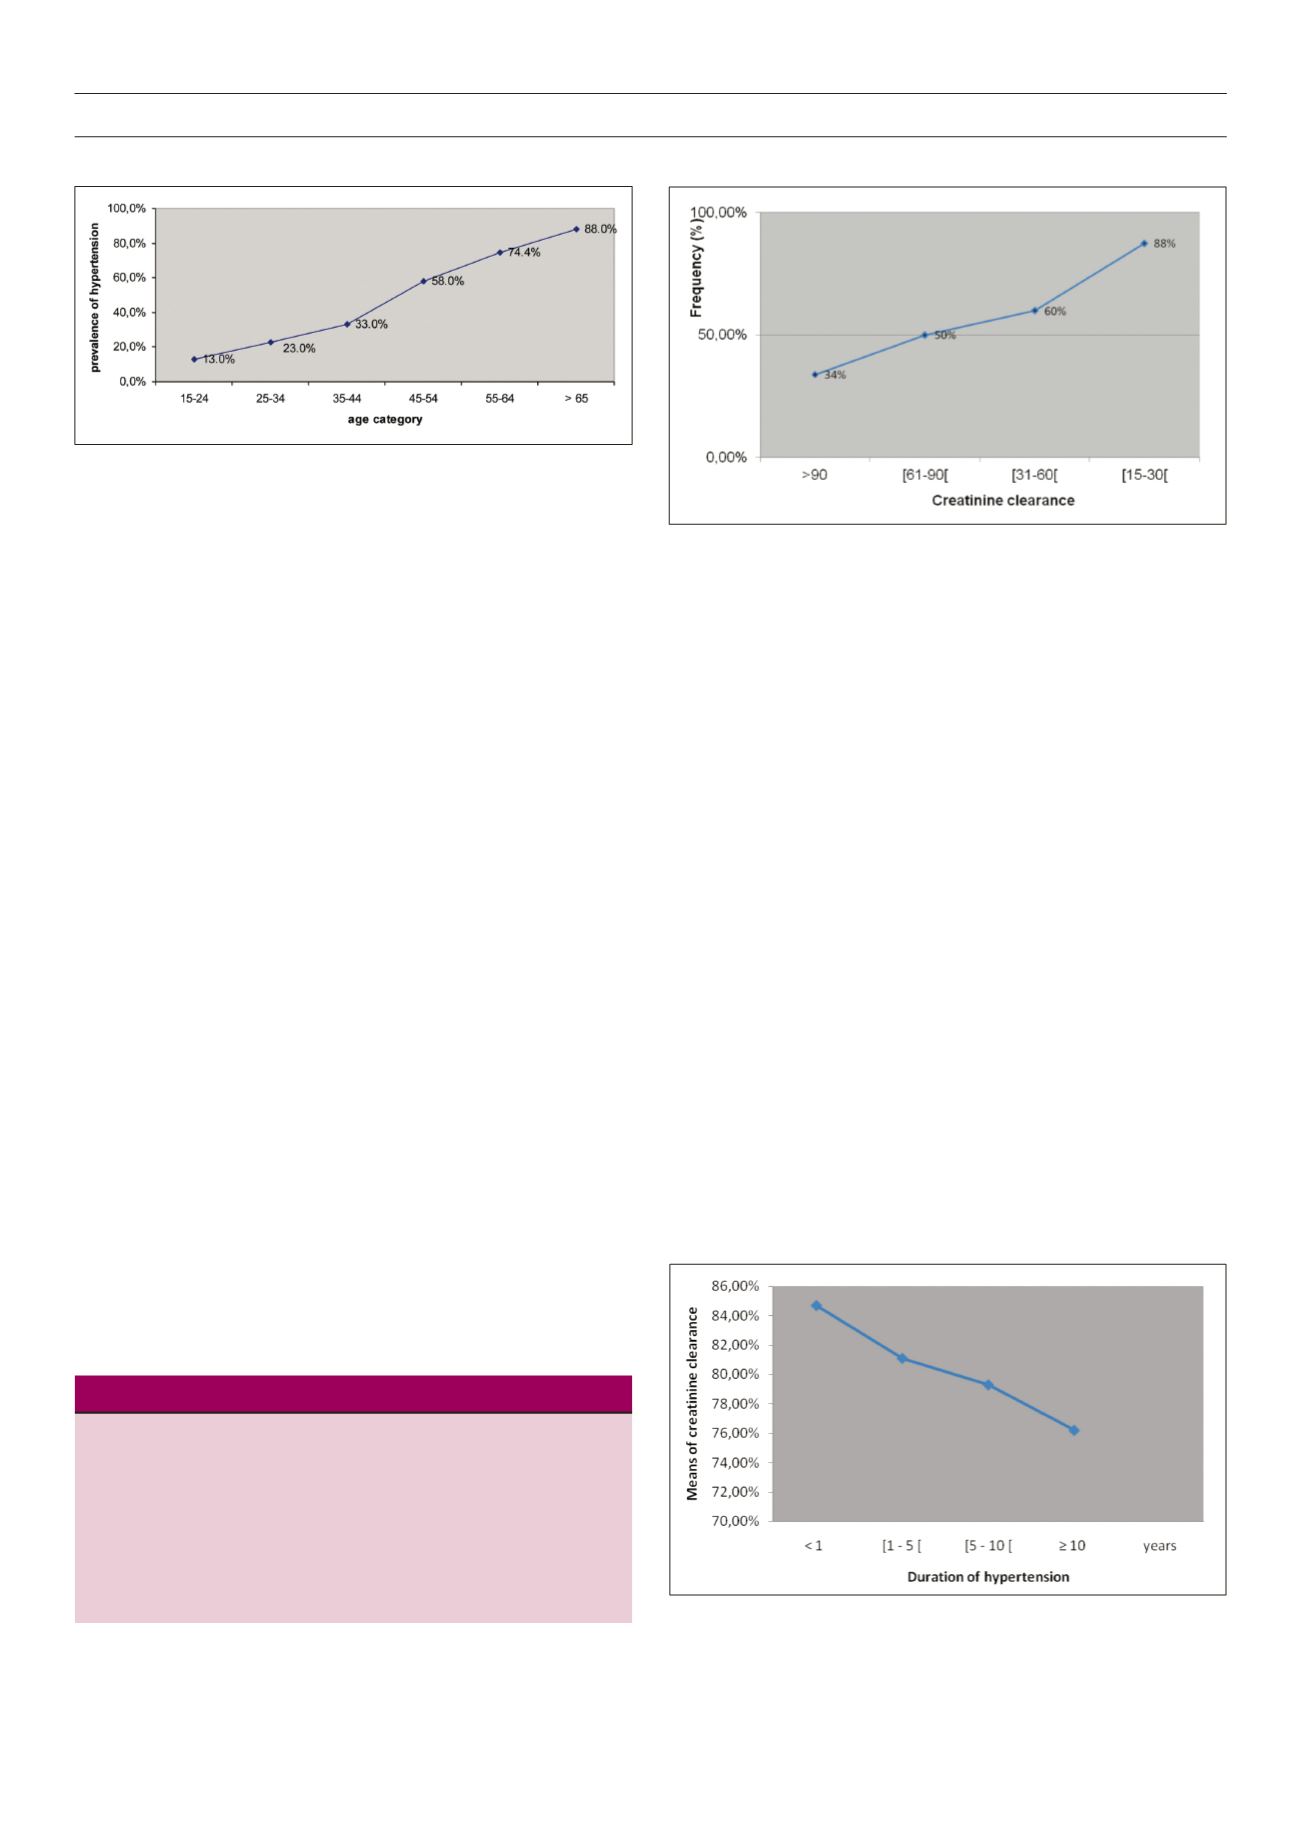
< 0.001). HTN was correlated with the creatinine level (
p
< 0.05)
(Fig. 3). The mean clearance rate of creatinine gradually decreased
with the duration of hypertension (Fig. 4) (
p
= 0.26).
Discussion
In order to gather data on the frequency of HTN and associated risk
factors in urban Saint Louis residents, we carried out a population-
based, cross-sectional survey with a methodology closed to the
WHO STEPwise approach. We found a significant increase in the
prevalence of HTN.
A previous study performed in the same region in 1970 found a
prevalence of 4.9% in a rural population, whereas the prevalence
was 7% in an urban population. Even though the methodology
(HTN if BP ≥ 160/95 mmHg) in this study was not similar to ours,
our results suggest a significant increase in the prevalence of HTN
since 1970.
8
Moreover, Kane
et al
. in 1995 found a prevalence
of 20.2% with a methodology very similar to ours.
5
In the sub-
Saharan African region, two studies have reported a median
prevalence of 28%, with a regional variation ranging from 15 to
38.6%.
1,9
Changes in lifestyle may be the major factor leading to
this increasing prevalence of HTN and other cardiovascular risk
factors.
9-11
While we have not found significant associations between HTN
and level of education, it should be noted that previous studies
Table 3.
Prevalence of hypertension in socio-professional category
Number
Hypertension (%)
p
Official
71
36.6
1
Private
72
25
0.13
Self employed
496
48.2
0.06
Volunteer
9
22.2
0.39
Housewife
528
50.9
0.023
Student
130
10
< 0.001
Unemployed
35
57.1
0.045
Retired
83
81.9
< 0.001
Figure 4:
Means of creatinine clearance by duration of hypertension
Figure 2.
Prevalence of hypertension by age (
n
= 655).
Figure 3.
Prevalence of hypertension by creatinine clearance rate (
n
= 655).