


 20 / 52

RESEARCH ARTICLE
SA JOURNAL OF DIABETES & VASCULAR DISEASE
70
VOLUME 13 NUMBER 2 • DECEMBER 2016
The efficacy of SES versus BMS is presented in Table 2. As shown,
the pooled OR was 0.42 (95% CI: 0.24–0.74,
p
< 0.01) for SES
versus BMS. This suggests that, after the data had been pooled,
SES were more effective than BMS in CAD patients with diabetes.
However, there was publication bias (
t
= –4.19,
p
< 0.05).
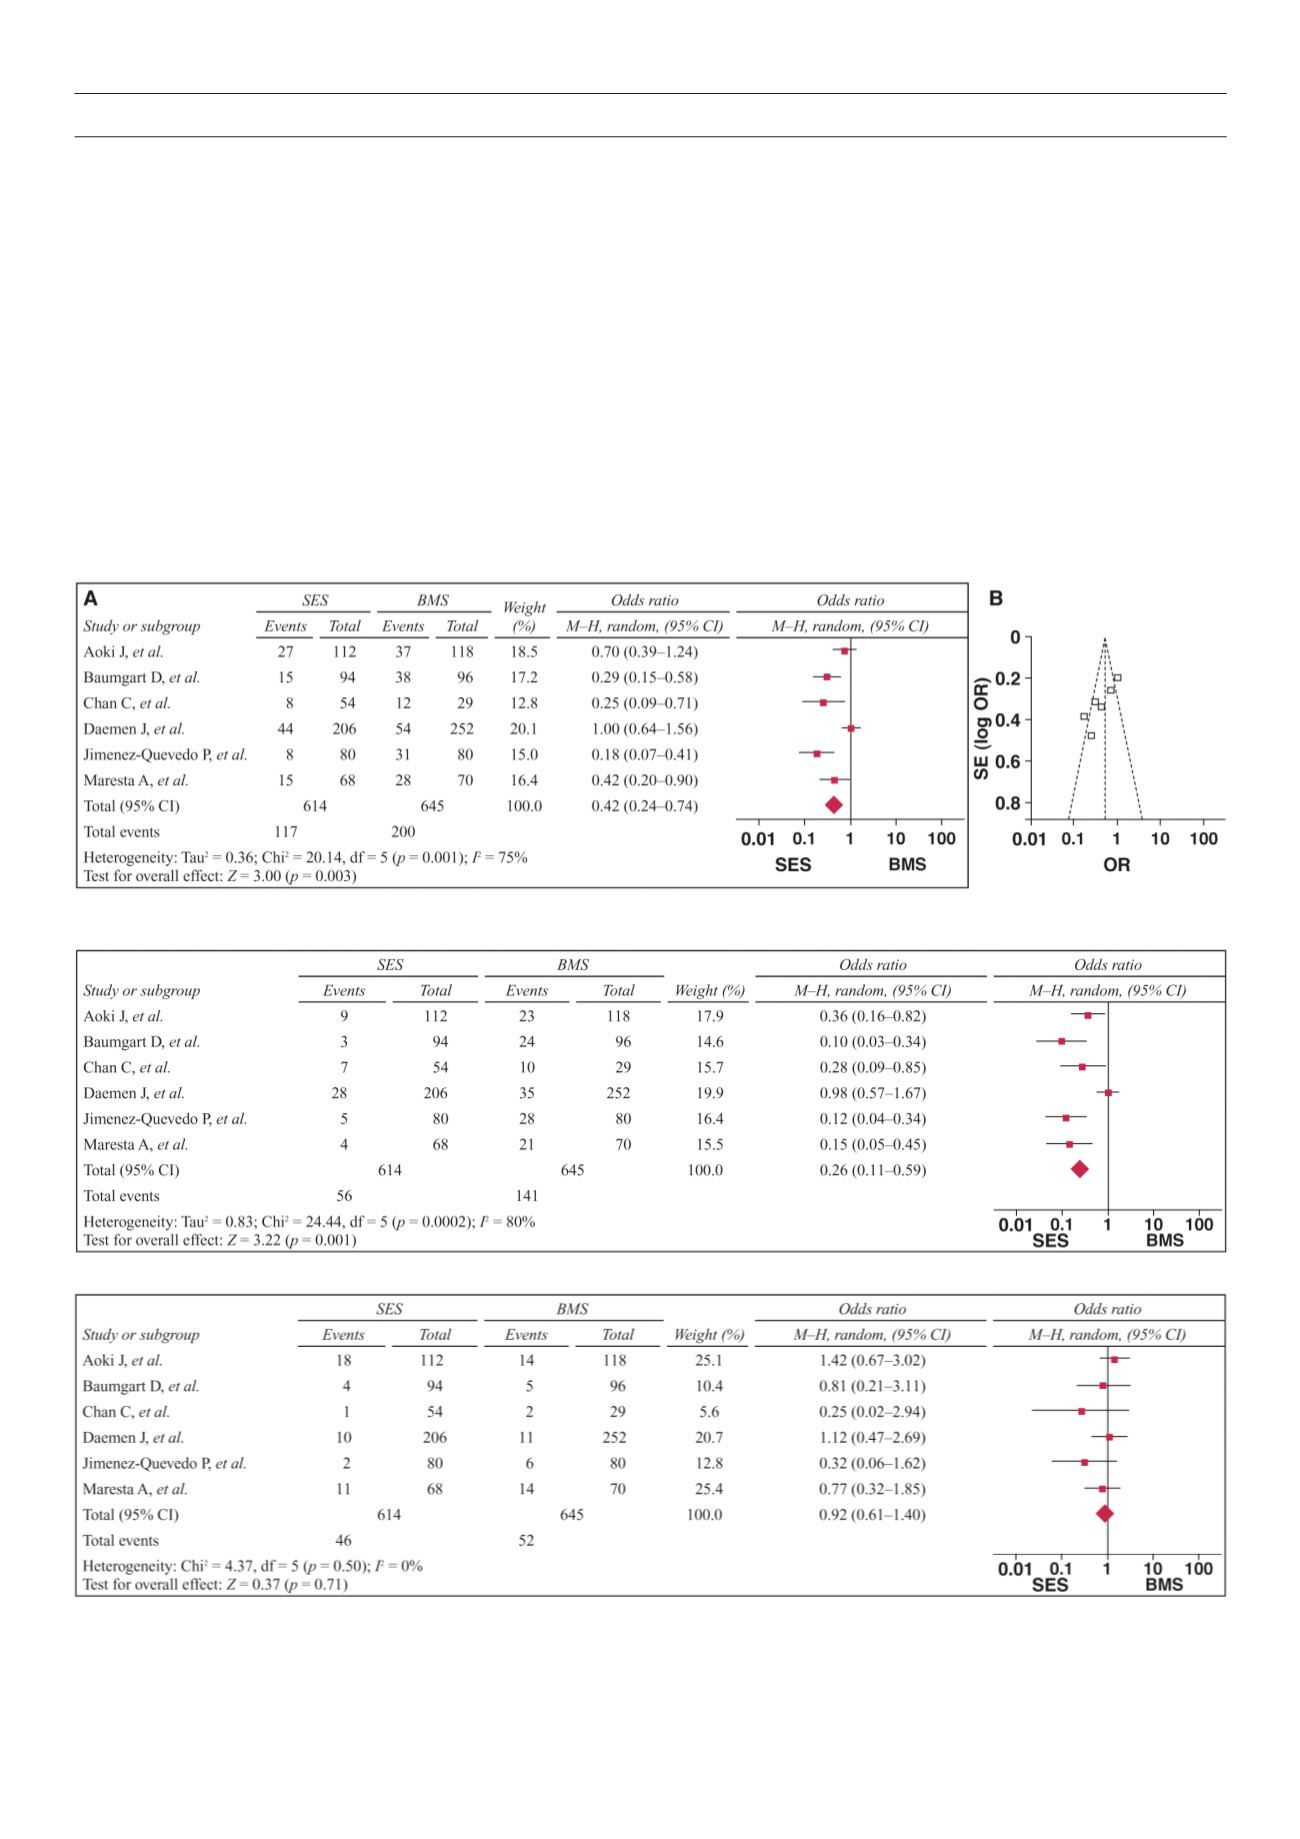
As shown in Fig. 2A, the pooled OR was 0.42 (95% CI: 0.24–
0.74,
p
< 0.01) for overall events, suggesting that SES had a better
outcome compared with BMS, with a greater reduction in risk for
major cardiac events. However, there were heterogeneities between
the studies (
Q
2
= 20.14,
I
2
= 75.0%,
p
< 0.1) and publication bias,
as shown in Fig. 2B (asymmetric funnel plot). This was further
confirmed with Egger’s linear regression test, shown in Table 2 (
t
= –4.19,
p
< 0.05).
As shown in Fig. 3, the pooled OR was 0.26 (95% CI: 0.11–
0.59,
p
< 0.01) for SES versus BMS, suggesting that SES had a
better revascularisation rate for target lesions compared with
BMS. However, there were heterogeneities between the studies
(
Q
2
= 24.44,
I
2
= 80.0%,
p
< 0.1) and publication bias (
t
= –6.44,
p
< 0.05).
As shown in Fig. 4, the pooled OR was 0.92 (95% CI: 0.61–1.40,
p
> 0.05) for SES versus BMS, suggesting that the overall risk for
myocardial infarction was not significantly different between these
two groups. There was no heterogeneity between the studies (
Q
2
= 4.37,
I
2
= 0%,
p
> 0.1) but there was publication bias (
t
= –3.44,
p
< 0.05).
As shown in Fig. 5, the pooled OR was 1.19 (95% CI: 0.74–1.92,
p
> 0.05) for SES versus BMS, suggesting that the overall risk of
mortality was not significantly different between the groups. There
was no publication bias (
t
= –1.69,
p
> 0.05) or heterogeneities
between the studies (
Q
2
= 3.88, I2 = 0.0%,
p
> 0.1).
Subgroup analyses were stratified by sample size, subjects’
geographical area and study method. As shown in Table 2 and Fig.
Fig. 2 A
: Forest plots of studies with major adverse cardiac events in the SES group versus the BMS group.
B
: Funnel plots of studies with major adverse cardiac events
in the SES group versus the BMS group.
Fig. 3.
Forest plots of studies with target-lesion revascularisation events in the SES group versus the BMS group.
Fig. 4.
Forest plots of studies with myocardial infarction events in the SES group versus the BMS group.