


 19 / 52

SA JOURNAL OF DIABETES & VASCULAR DISEASE
RESEARCH ARTICLE
VOLUME 13 NUMBER 2 • DECEMBER 2016
69
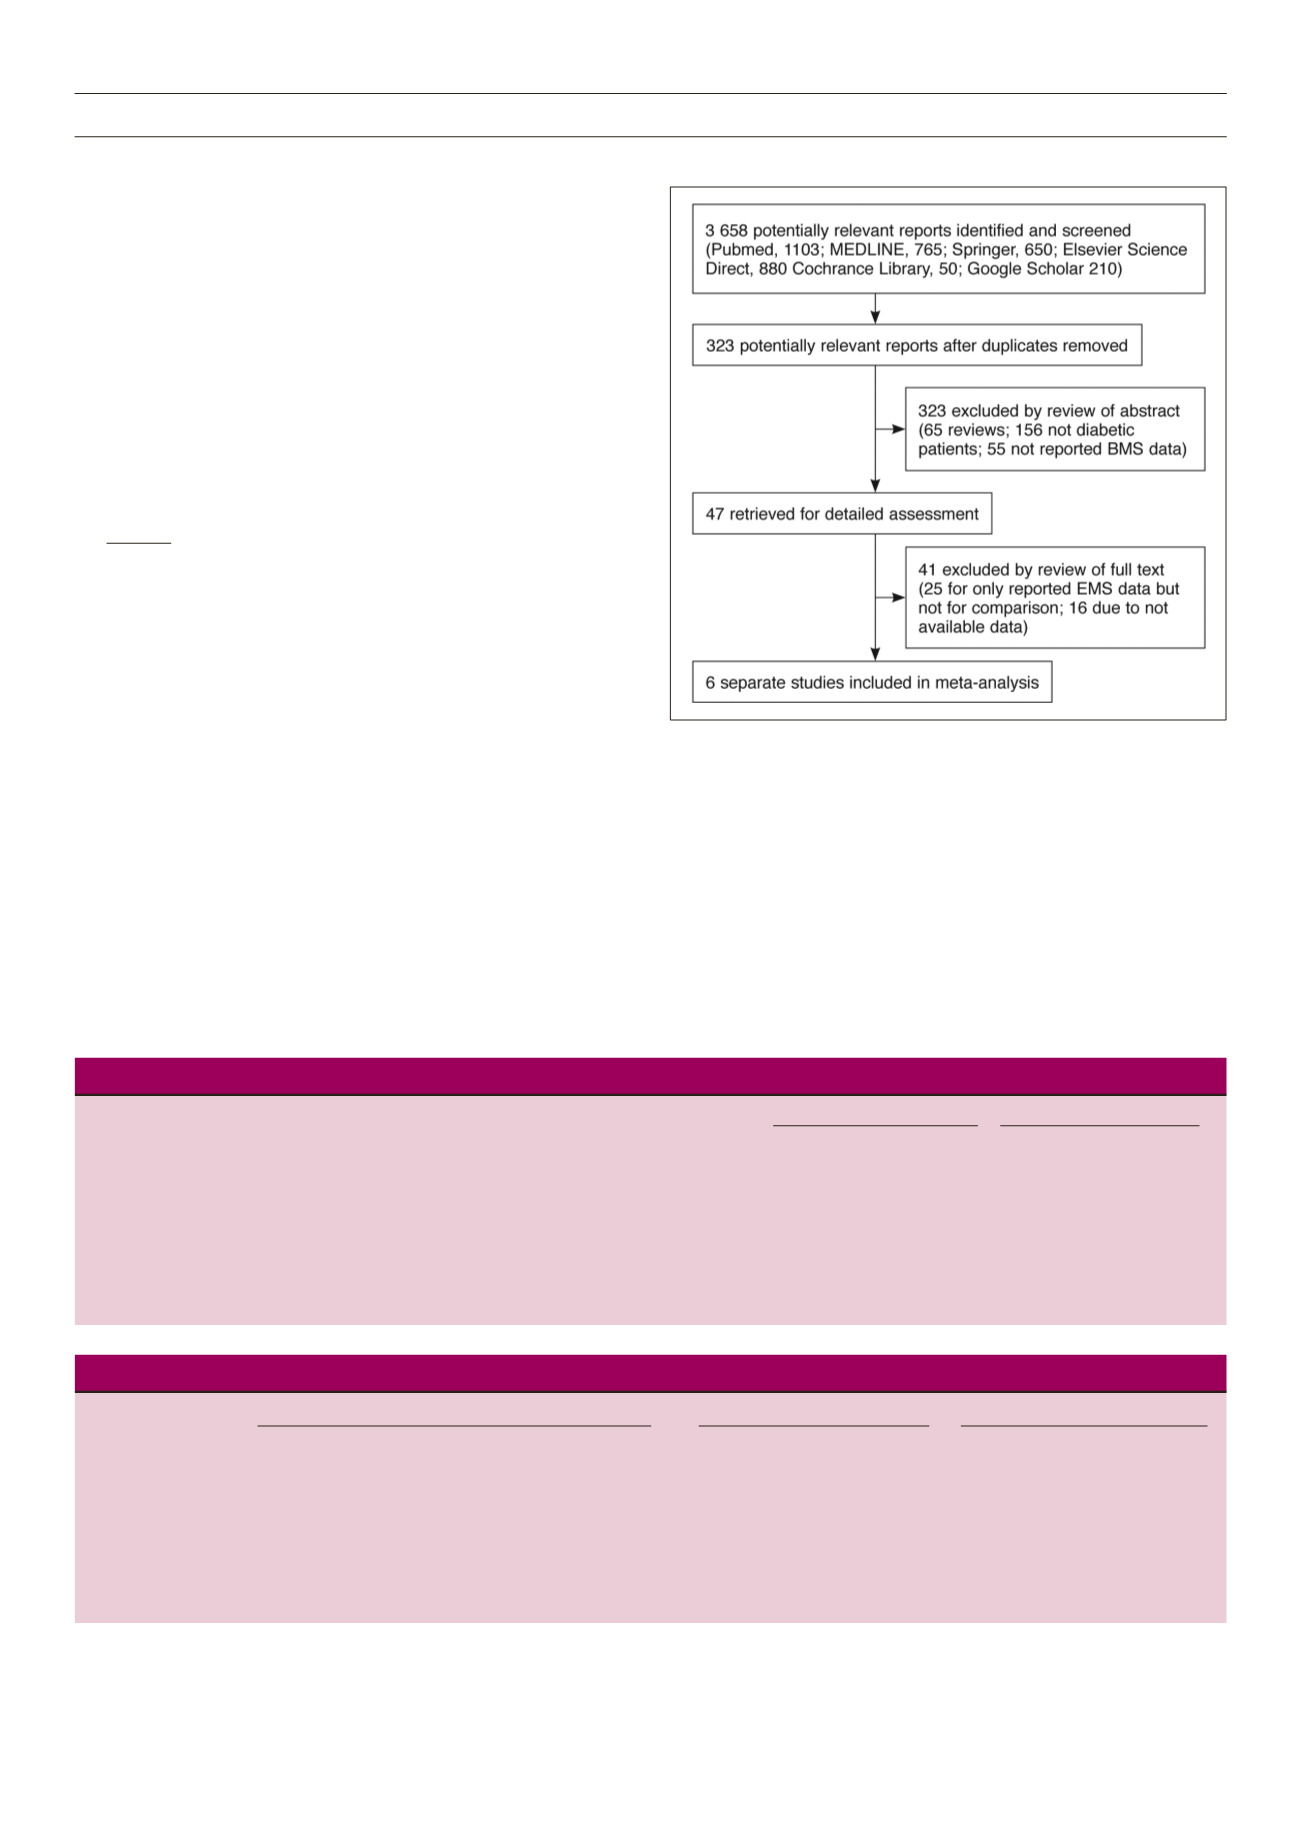
patients, 55 did not report on BMS data). Among the remaining 47,
another 41 were excluded (25 only reported on BMS data without
comparisons, 16 were excluded due to unavailable data). Finally, six
studies were included in this meta-analysis.
The characteristics of the included studies are presented in
Table 1. These six studies were conducted from 2002 to 2006 and
published between 2005 and 2008, three in Europeans, two in
Americans, and one in Asians and Americans. A total of 1 259
CAD subjects with diabetes (SES 614 and BMS 645) were included,
with an average age of 65 years. The sample sizes ranged from 83
to 458, and the studies were RCTs and non-RCTs.
Fig. 1.
Flow chart of selection of the studies.
Statistical analysis
Analysis was performed with software review manager 5.1
(Cochrane collaboration,
http://ims.cochrane.org/revman) and
comprehensive meta-analysis (Englewood, NJ);
p
< 0.05 was
regarded as statistically significant. Meta-analysis was performed in
fixed- or random-effect models.
Odds ratios (OR) and95%confidence intervals (CI)were estimated
in each study. Pooled ORs were obtained using the Mantel–Haenszel
method in a fixed-effect model, and the DerSimonian–Laid method
in a random-effects model.
24
The significance of pooled ORs was
determined by the Z-test. Cochrane’s Q-statistic was used to assess
within- and between-studies variations. A
p
< 0.10 on the
Q
-statistic
was regarded as heterogeneity across the studies.
I
2
was also used
to test heterogeneity with the formula:
I
2
= (
Q
− df)
Q
× 100%
where
I
2
< 25% means no heterogeneity;
I
2
= 25–50% means
moderate heterogeneity;
I
2
> 50% means large or extreme
heterogeneity.
27
The random-effects model was also used for evaluating the
possibility of heterogeneity of studies. Publication bias was
evaluated with Egger’s test and funnel plots,
28
which compensate
for each other’s drawbacks. If there is evidence of publication
bias, the funnel plot is noticeably asymmetric. For the Egger’s test
the significance level was set at 0.05. Sensitivity analysis was also
performed to test reliability of the results, by removing one study at
a time and repeating the meta-analysis.
Results
As shown in Fig. 1, among 3 658 articles potentially relevant to
the search terms (PubMed: 1 103; MEDLINE: 765; Springer: 650;
Elsevier Science Direct: 880; Cochrane Library: 50; Google Scholar:
210), 323 potentially relevant studies were selected after the
duplicates were removed. When the abstracts were screened, 276
were excluded (65 were review articles, 156 were not diabetic
Table 1.
Characteristics of studies included in the meta-analysis.
Study Follow up SES group BMS group
Study
Study year
Country Ethnicity
method (years)
Sample size Age (years) Sample size Age (years)
Aoki J,
et al
.
2002–2003 Netherlands
European
Non-RCT
1
112
63 ± 10
118
64 ± 11
Jimenez-Quevedo P,
et al
.
2003
United States
America
RCT
1
80
65.4 ± 8
80
67.9 ± 9
Baumgart D,
et al
.
2002–2004
Germany
European
RCT
1
94
66 ± 9
96
66 ± 10
Daemen J,
et al
.
2002–2003 United States
America
Non-RCT
1
206
62.0 ± 10
252
62.7 ± 10
Chan C,
et al
.
2002–2004 United States
America
and Asia
and Asian RCT
1
54
58.7 ± 9.7
29
62.5 ± 10.3
Maresta A,
et al
.
2004–2006
Italy
European
RCT
1
68
71 ± 9
70
69 ± 9
Table 2.
Pooled odds ratio for the SES versus the BMS group.
Random model Test of heterogeneity Egger’s test for publication bias
Subgroups
No. of studies OR (95% CI)
Z
p
-value
Q p
-value 12 (%)
t
p
-value
Overall effects
6
0.42 (0.24–0.74)
3.00
< 0.01
20.14
< 0.01
75.2
–4.19
0.014
Sample size ≤ 90
3
0.28 (0.16–0.48)
4.60
< 0.01
2.39
0.303
16.3
–3.66
0.62
Sample size > 90
3
0.61 (0.31–1.21)
1.42
0.15
8.70
0.013
77.0
–9.26
0.20
RCT
4
0.28 (0.19–0.42)
6.14
< 0.01
2.40
0.495
0.0
–2.36
0.531
Non-RCT
2
0.87 (0.61–1.24)
0.76
0.446
0.92
0.338
0.0
–5.29
–
European
3
0.45 (0.27–0.77)
2.95
< 0.01
3.71
0.156
46.1
–7.98
0.46
American and Asian
3
0.37 (0.11–1.27)
1.58
0.115
15.55
< 0.01
87.1
–5.92
0.23