


 15 / 52

SA JOURNAL OF DIABETES & VASCULAR DISEASE
RESEARCH ARTICLE
VOLUME 13 NUMBER 2 • DECEMBER 2016
65
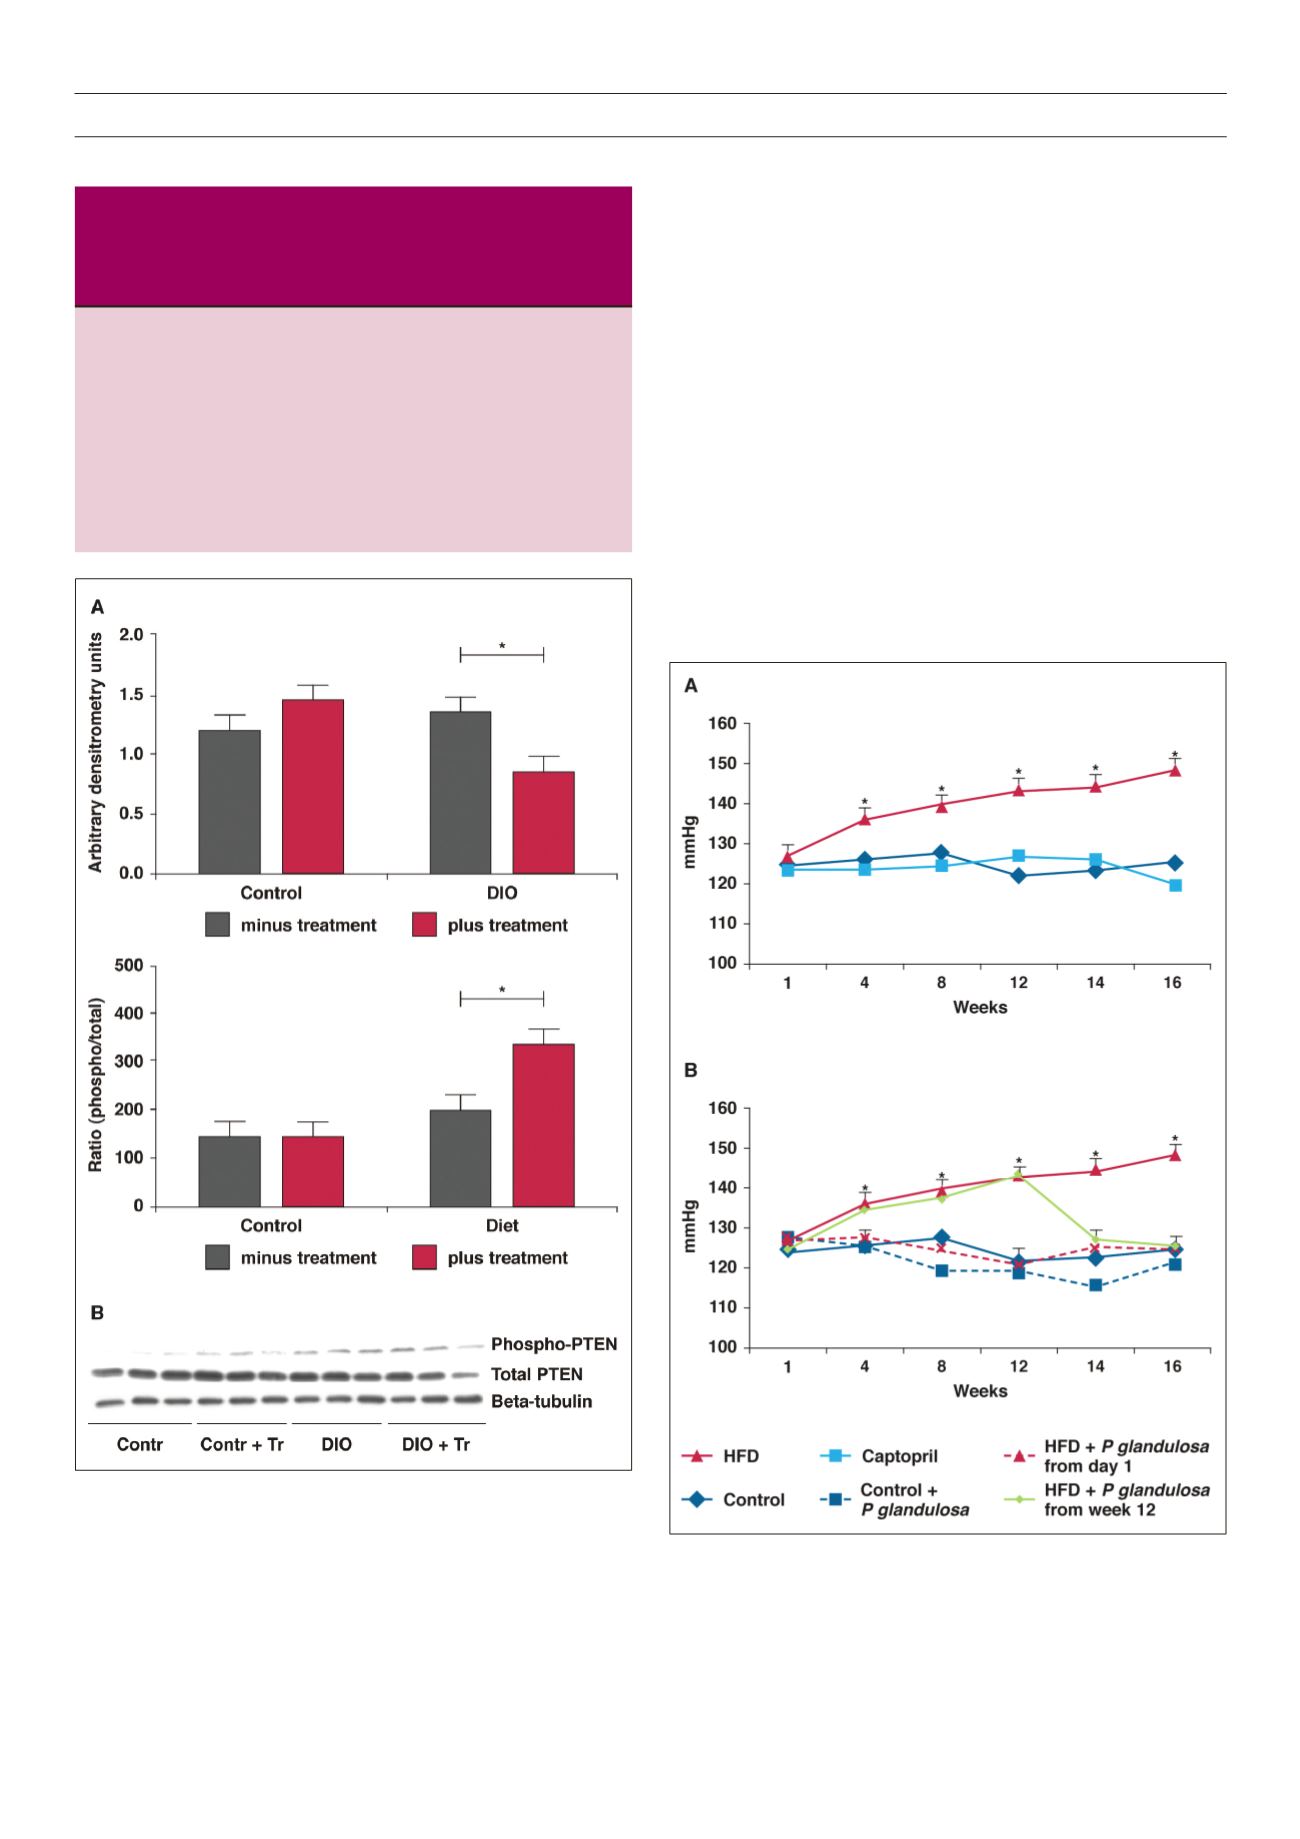
As can be seen in Fig. 6A, captopril prevented the development
of hypertension in the animals. Similarly,
P glandulosa
treatment
prevented the development of high blood pressure in these animals
when given in conjunction with the high-fat diet.
P glandulosa
treatment did not significantly affect the animals on the control
diet (Fig. 6B). In addition, treatment of already hypertensive animals
(week 12) with
P glandulosa
normalized their blood pressure within
two weeks.
Effects on urine production
Measuring the urine output of the animals by keeping them
separately in metabolic cages showed that after the 12-week
treatment period, the urine output of animals on the control
diet was 17.37 ± 0.8 ml while those on the high-fat diet had a
significantly lower urine output of 9.8 ± 0.55 ml (
p
< 0.001,
n
= 9
per group).
Captopril treatment elevated the urine output to 15 ± 0.9 ml.
Treatment with
P glandulosa
also elevated urine output to 13.68 ±
0.80 ml (
p
< 0.01,
n
= 9 per group) (Fig. 7).
Table 2.
Summary of the western blot analyses of the proteins involved
in the insulin signal transduction pathway with arrows indicating the
effect induced by the di
et al
one or the diet in combination with
P
glandulosa
treatment. Hearts were freeze-clamped in the basal state
without any interventions.
Protein
Effect of diet
Effect of treatment
Glut 1
↔
↔
Glut 4
↔
↔
IR-beta
↔
↔
PKB/Akt
P/T
↓
P/T
↑
p85
↓
↔
PTEN
↔
T
↓
P/T
↑
P = phosphorylated protein, T = total protein; P/T = the ratio of phosphorylated
to total protein,
n
= 6 individual hearts per group.
Fig. 5.
Hearts from the treated and untreated DIO animals were removed without
any intervention and stored in liquid nitrogen. Tissue lysates were prepared
and Western blotting was performed as described in Methods.
A
: bar charts
of the expression of the PTEN protein as well as the ratio of phosphorylated
vs total protein. *
p
< 0.05,
n
= 6 individual hearts analysed per group.
B
is
a representative blot depicting these proteins and beta-tubulin, used as an
indicator of equal loading.
Fig. 6.
Rats were fed a high-fat diet for 16 weeks and blood pressure was
monitored on a weekly basis as described in Methods. *
p
< 0.001 vs control
and captopril,
n
= 9 per group.
A
: HFD vs captopril,
B
: HFD vs P glandulosa
treatment.