
SA JOURNAL OF DIABETES & VASCULAR DISEASE
RESEARCH ARTICLE
VOLUME 16 NUMBER 2 • NOVEMBER 2019
59
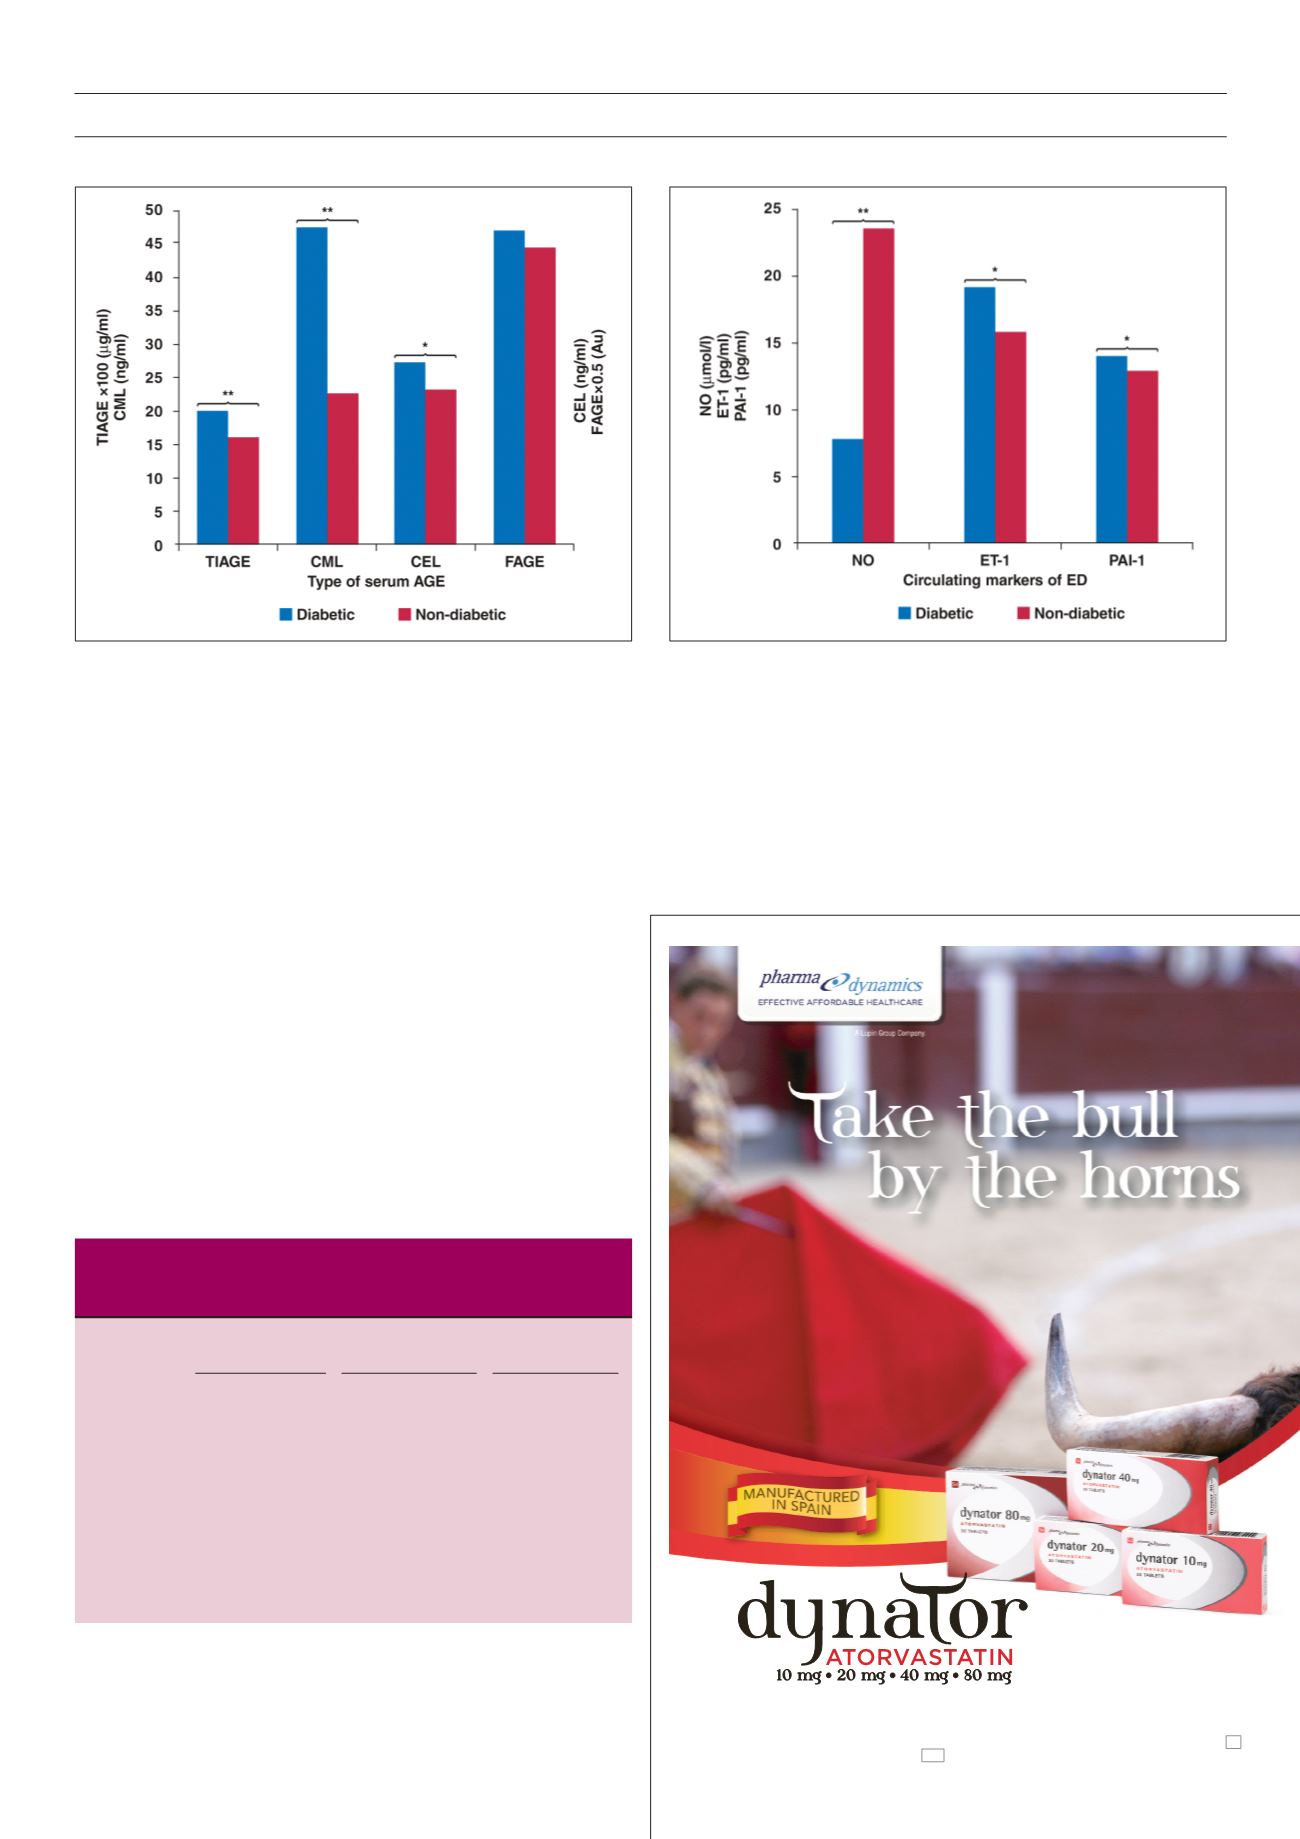
As shown in Fig. 1, the mean serum levels of TIAGEs, CML and
CEL were significantly higher in the diabetic than the non-diabetic
group (
p
< 0.001,
p
< 0.001 and
p
< 0.01, respectively). On the
other hand, there was no significant difference between serum
FAGE levels of the diabetic and non-diabetic groups.
As shown in Fig. 2, the mean NO serum level of the diabetic
patients was significantly lower than that of the non-diabetic
control group (
p
< 0.001). On the other hand, the mean serum
ET-1 and PAI-1 levels of the diabetic group were significantly higher
than those of the control group (
p
< 0.05) (Fig. 2).
Gender and age of the study subjects, as well as the different
types of serum AGEs (TIAGEs, CML, CEL and FAGEs) measured in
the diabetic group were correlated with the corresponding selected
circulating markers of endothelial dysfunction (NO, ET-1 and PAI-1)
using the Spearman rank correlation coefficient (rs).
Results shown in Table 2 suggest a significant weak negative
correlation (
p
< 0.05) between the age of the study subject and
serum levels of NO, as well as a significant moderate negative
correlation between serum TIAGE and NO levels (
p
< 0.05), and
between serum CML and NO levels (
p
< 0.05) (Table 2). Table 2 also
shows a significant weak positive correlation between serum TIAGE
and ET-1 levels (
p
< 0.05), as well as between serum CML and ET-1
levels (
p
< 0.05).
Table 2.
Correlations between age of the study subjects, gender, differ-
ent types of serum AGEs and selected circulating markers of endothe-
lial dysfunction
Serum NO Serum ET-1
Serum PAI-1
(pmol/l)
(ng/ml)
(ng/ml)
Parameters
r
s
p
-value
r
s
p
-value
r
s
p
-value
Age
–0.236* 0.031
0.149 0.302
0.080 0.582
Gender
0.191
0.896
0.048 0.741
–0.230 0.109
TIAGEs (μg/ml) –0.382* 0.026
0.279* 0.012
–0.185 0.108
CML (ng/ml) –0.412* 0.011
0.281* 0.021
–0.228 0.112
CEL (ng/ml)
–0.015
0.920
0.150 0.297
–0.145 0.758
FAGEs (Au)
0.050
0.722
–0.036 0.802
0.175 0.224
rs: Spearman rank correlation coefficient; TIAGEs: total immunogenic
advanced glycation end-products; CML: N
ε
-carboxymethyl-lysine; CEL:
N
ε
-carboxyethyl-lysine; FAGEs: fluorescent advanced glycation end-products;
Au: arbitrary units; *Correlation is significant at
p
< 0.05 level.
Fig. 1.
Comparison of median levels of total immunogenic AGEs (TIAGEs),
N
ε
-carboxymethyl-lysine (CML), N
ε
-carboxyethyl-lysine (CEL) and fluorescent
AGEs (FAGEs) between the type 2 diabetes and non-diabetic control groups.
*Significant at
p
< 0.01, **significant at
p
< 0.001.
Fig. 2.
Comparison of mean serum levels of nitric oxide (NO), endothelin-1
(ET-1) and plasminogen activator inhibitor (PAI-1) between the type 2 diabetes
and non-diabetic control groups. *Significant at
p
< 0.05; **significant at
p
< 0.01.
DYNATOR 10, 20, 40, 80 mg.
Each tablet contains 10, 20, 40, 80 mg atorvastatin respectively. S4
A43/7.5/0167, 0168, 0169, 0170. NAM NS2 13/7.5/0111, 0112, 0113, 0114. For full prescribing information,
refer to the professional information approved by SAHPRA, 02 June 2017.
1)
Klug E,
et al.
South African
dyslipidaemia guideline consensus statement.
S Afr Med J
. 2012;102:177-188.
DRB625/10/2019.
CUSTOMER CARE LINE
0860 PHARMA (742 762) / +27 21 707 7000
www.pharmadynamics.co.za“Intensive management
of dyslipidaemia in
South Africa will
significantly reduce the
cardiovascular disease
health burden”
1


