


 32 / 48

RESEARCH ARTICLE
SA JOURNAL OF DIABETES & VASCULAR DISEASE
70
VOLUME 14 NUMBER 2 • DECEMBER 2017
D rats observed between 15 and 25 minutes of the test, we noted
that melatonin treatment had no significant effect on basal glucose
levels and the overall area under curve in both groups (Fig. 5).
Discussion
Our aim was to investigate the effect of melatonin treatment on
basal glucose uptake and insulin responsiveness as indicated by
glucose uptake, using cardiomyocytes isolated from young control
rats, age-matched controls and obese, insulin-resistant rats. The
results indicated that (1) melatonin treatment
in vitro
had no effect
on glucose uptake but increased insulin-stimulated glucose uptake
by cardiomyocytes from only the young and age-matched control
rats (Fig. 1B, Table 1); (2) melatonin treatment
in vivo
increased
basal and insulin-stimulated glucose uptake by cardiomyocytes
isolated from the hearts of obese, insulin-resistant rats.
During the basal state, glucose transport is commonly considered
the rate-limiting step for muscle glucose metabolism.
37
The
involvement of melatonin in glucose uptake was supported by the
observation that pinealectomised animals develop insulin resistance
associated with a decrease in glucose uptake by adipose tissue.
15,38
Accordingly, administration of melatonin reversed pinealectomy-
induced insulin resistance and improved glucose uptake by isolated
adipose tissue.
15,38
In contrast to this, our data show that melatonin
per se had no significant effect on
in vitro
glucose uptake by
cardiomyocytes isolated from young normal or obese rats and their
age-matched controls (Fig. 1A, Tables 1, 2). A similar observation
was previously reported in rat skeletal muscle cells
39
and chick
brain,
40
as well as in adipose tissue from a female fruit bat.
41
Of interest was our finding that acute melatonin administration
in
vitro
enhanced insulin-stimulated glucose uptake by cardiomyocytes
from normal young rats (Fig 1B) as well as the control rats fed for
16 to 19 weeks (Fig. 2). The enhanced insulin responsiveness of
glucose uptake may be related to a synergistic interaction between
melatonin and insulin action, supporting the insulin-sensitising
effect by melatonin, as previously demonstrated.
39,41,42
The
in vitro
melatonin-enhancing effect on insulin-stimulated
glucose uptake was not observed in cardiomyocytes isolated from
either the control or obese groups fed for more than 20 weeks
(Fig. 3), indicating a progressive loss of the synergistic interaction
between melatonin and insulin action. Although this is difficult
to explain, it may have resulted from ageing in the control group,
as previously demonstrated.
43
On the other hand, cardiomyocytes
from obese animals fed for 16 to 19 weeks were almost as insulin-
responsive as the control cardiac myocytes, but did not exhibit the
potentiating effect of melatonin compared to the control group.
Various physiological factors such as an effect on adiponectin and
leptin may have contributed to the overall effect of
in vivo
melatonin
on glucose uptake, as previously discussed.
10
In a preventative-
treatment setting, 16 weeks of melatonin consumption, starting
before the establishment of obesity, reduced hypertriglyceridaemia
and increased high-density lipoprotein cholesterol levels in rats
fed the same high-calorie diet.
32
However, the exact mechanism
whereby
in vivo
melatonin treatment affects glucose homeostasis
and enhances insulin responsiveness is complex and not fully
elucidated.
Melatonin induced a significant reduction in body weight,
associated with a concomitant increase in basal glucose uptake
by isolated cardiomyocytes from the obese rats. This effect is
consistent with previous observations that chronic melatonin
treatment reduced body weight gain and insulin resistance in
mice
11
and rats
21
fed a high-fat diet, as well as in old obese
28
and
young Zucker diabetic fatty
13
rats. Therefore, melatonin action may
involve melatonin receptors and various indirect effects on the
liver, pancreas and other peripheral insulin-sensitive organs, such
as adipose tissue and skeletal muscle.
25
A recent report shows that
the removal of melatonin receptors (MT1 or MT2) in mice abolished
the daily rhythm in blood glucose levels,
44
confirming the role of
melatonin signalling in the control of glucose homeostasis.
Contrary to the
in vitro
situation, melatonin administered
in vivo
increased basal glucose uptake by cardiomyocytes isolated from
obese rats. Mechanistically, this may involve glucose transporter
1 (GLUT1), which is usually associated with basal glucose uptake
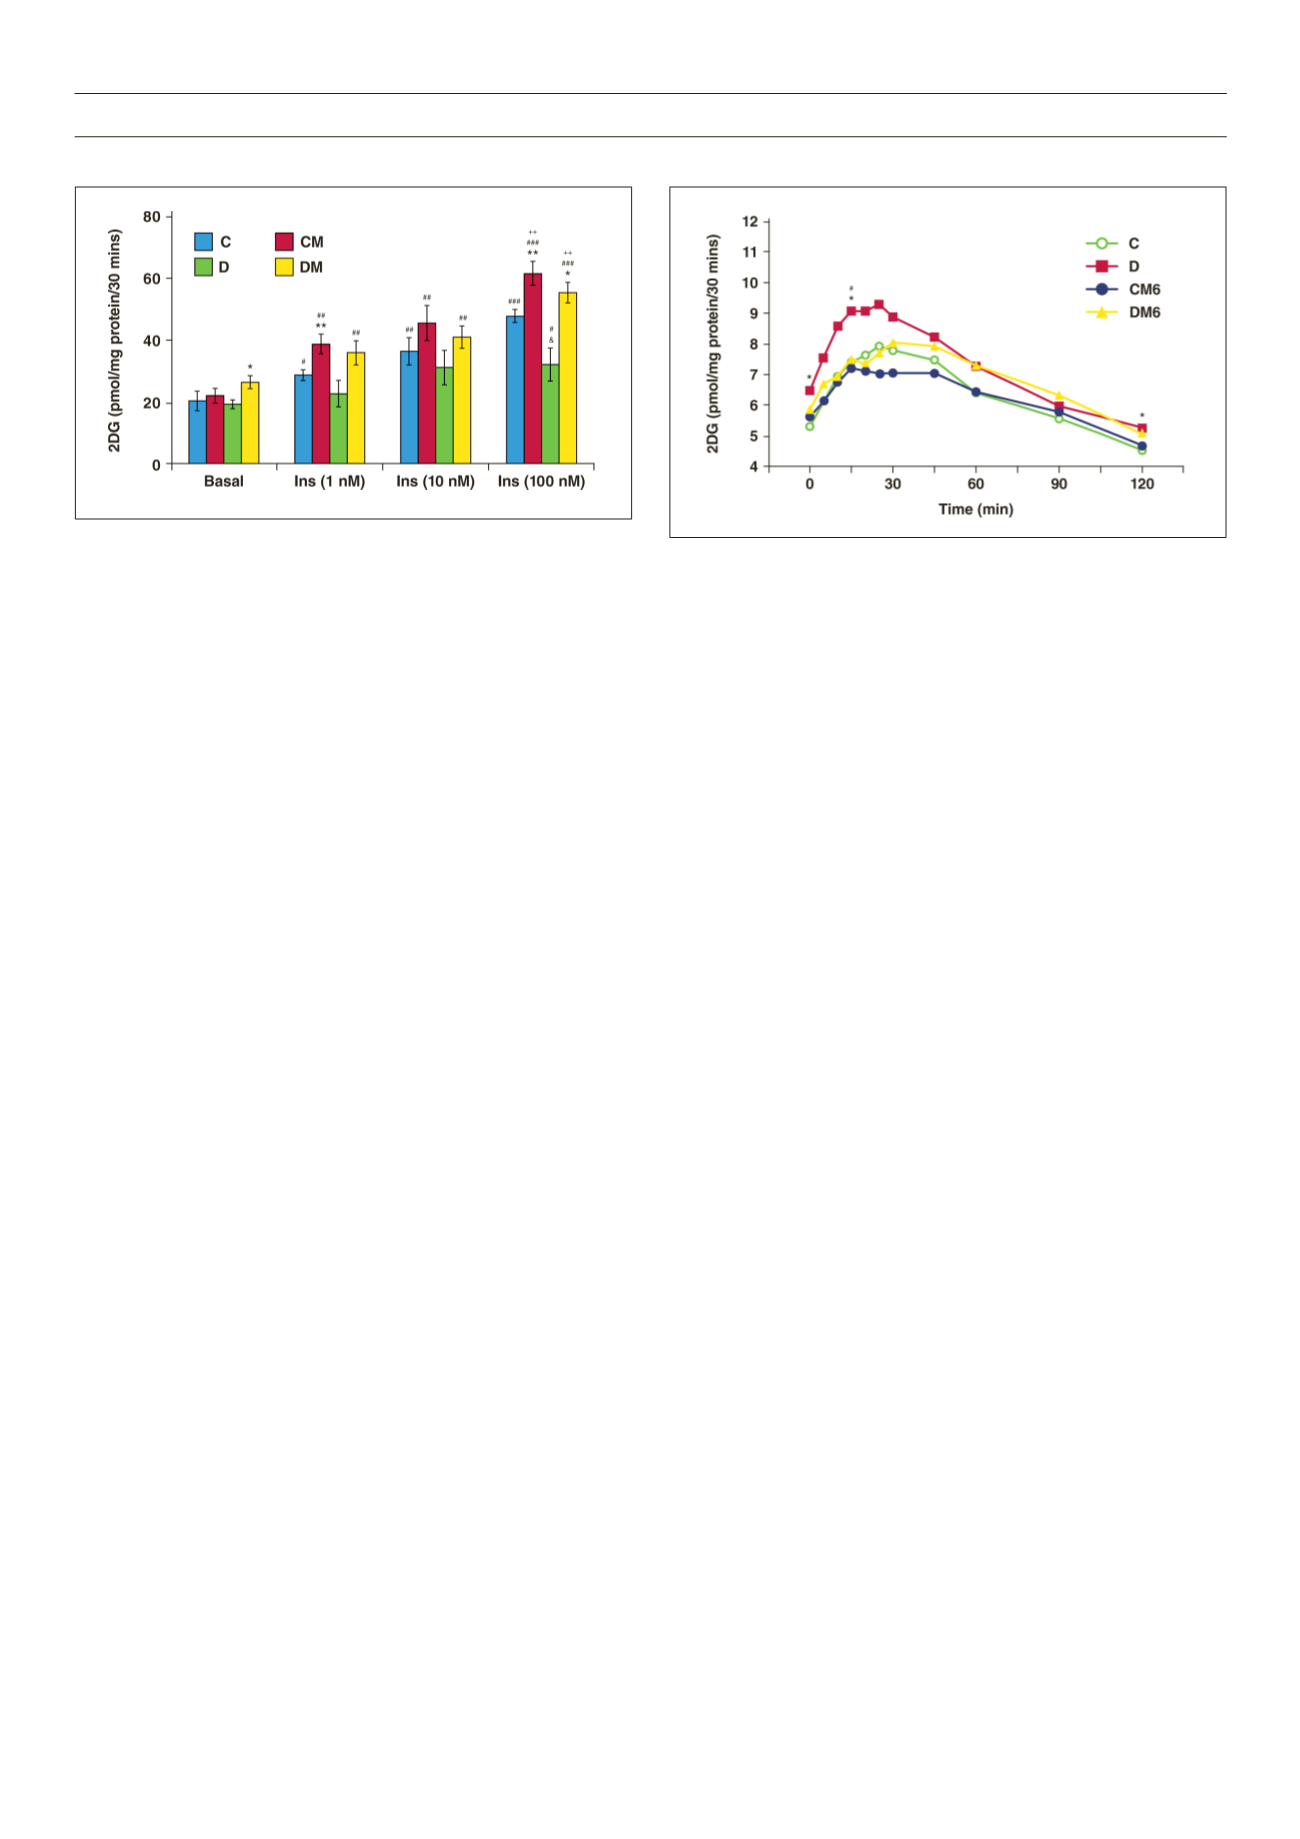
Figure 4.
Effect of
in vivo
melatonin treatment (for the last six weeks of feeding)
on insulin-stimulated glucose uptake by cardiomyocytes isolated from rats fed a
high-calorie diet (20 weeks). Cardiomyocytes were isolated and stimulated with
increasing concentrations of insulin for a period of 30 minutes. The accumulated
radiolabelled 2DG was measured and expressed as pmol/mg protein/ 30 min. Ins:
insulin, C: control, CM: control with melatonin, D: high-calorie diet (dietinduced
obesity), DM: diet with melatonin. Treated vs untreated (same dose of insulin or
basal): *
p
< 0.05 (DM vs D), **
p
< 0.01 (CM vs C). Different doses of insulin vs
basal (same group of treatment):
#
p
< 0.05 vs basal,
##
p
< 0.01 vs basal,
###
p
<
0.001 vs basal. C vs D (same dose of insulin): and
p
< 0.05 (D vs C). Comparison
between different doses of insulin (same group of treatment):
++
p
< 0.01 vs 1 nM
Ins,
n
= four to six individual preparations/group; analysed in duplicate.
Figure 5.
Effect of
in vivo
melatonin treatment (for the last six weeks of feeding)
on intraperitoneal glucose tolerance. C: control, CM6: control with six weeks’
melatonin treatment, D: high-calorie diet (diet-induced obesity), DM6: high-
calorie diet with six weeks’ melatonin treatment, *
p
< 0.05 (D vs C),
#
p
< 0.05 (D
vs DM6),
n
= six per group.