


 13 / 52

SA JOURNAL OF DIABETES & VASCULAR DISEASE
RESEARCH ARTICLE
VOLUME 13 NUMBER 2 • DECEMBER 2016
63
setting 4. Lysates were cleared from particulate matter by
centrifuging for 15 min at 14 000 rpm in a microfuge (Eppendorf
Mini-spin plus, Hamburg, Germany) and the protein content was
determined by the method of Bradford.
16
Samples were diluted in
Laemmli sample buffer, boiled for 5 min and stored at –80°C.
Equal amounts of cytosolic proteins were separated on a SDS
poly-acrylamide gel and electro-transferred to ImmobilonTM-P
PVDF membranes. Transfer and equal loading of proteins was
determinedwith Ponceau red reversible stain. Themembranes were
blocked for two hours in Tris-buffered saline (TBS) containing 0.1%
Tween-20 and 5% non-fat milk powder and incubated overnight
in the primary antibodies (diluted in TBS–Tween according to the
manufacturer’s instructions). The following antibodies from cell
signalling were used: insulin receptor beta-subunit, phospho-PI3K
P85 (Tyr458), total and phospho-PTEN (Ser380/Thr382/383), total
and phospho-PKB/Akt (Ser473), Glut 1 and Glut 4.
Blots were stripped using a 5-min incubation in 2% NaOH
after washing in distilled water and re-probed with a beta-
tubulin antibody to confirm equal loading. Bands were visualised
using the ECL detection system and quantified by laser-scanning
densitometry with suitable software (Silk Scientific Inc, USA). For
comparison purposes, total pixels of bands were expressed as a
ratio of the mean of the controls on the same blot.
Statistical analysis
Data are presented as mean ± SEM and were analysed using either
a one-way or two-way ANOVA followed by a Bonferroni post-hoc
test for differences between groups. The blood pressure effects
were analysed using a repeated-measures two-way ANOVA.
Statistical significance was set at
p
< 0.05.
Results
After the 16-week diet animals from model 1 (DIO) presented
with significantly increased body- and intra-peritoneal fat weight
(Table 1). As summarised in Table 1, these animals had significantly
elevated blood glucose and insulin levels, leading to an increased
homeostatic model assessment of insulin resistance index
(HOMA-IR), indicative of whole-body insulin resistance.
In neither control nor DIO animals did the treatment with
P
glandulosa
have any effect on the body weight or the intraperitoneal
fat weight of the animals. After treatment of the DIO animals with
P glandulosa
, the blood glucose levels were no longer significantly
elevated compared to the treated controls but the HOMA-IR was
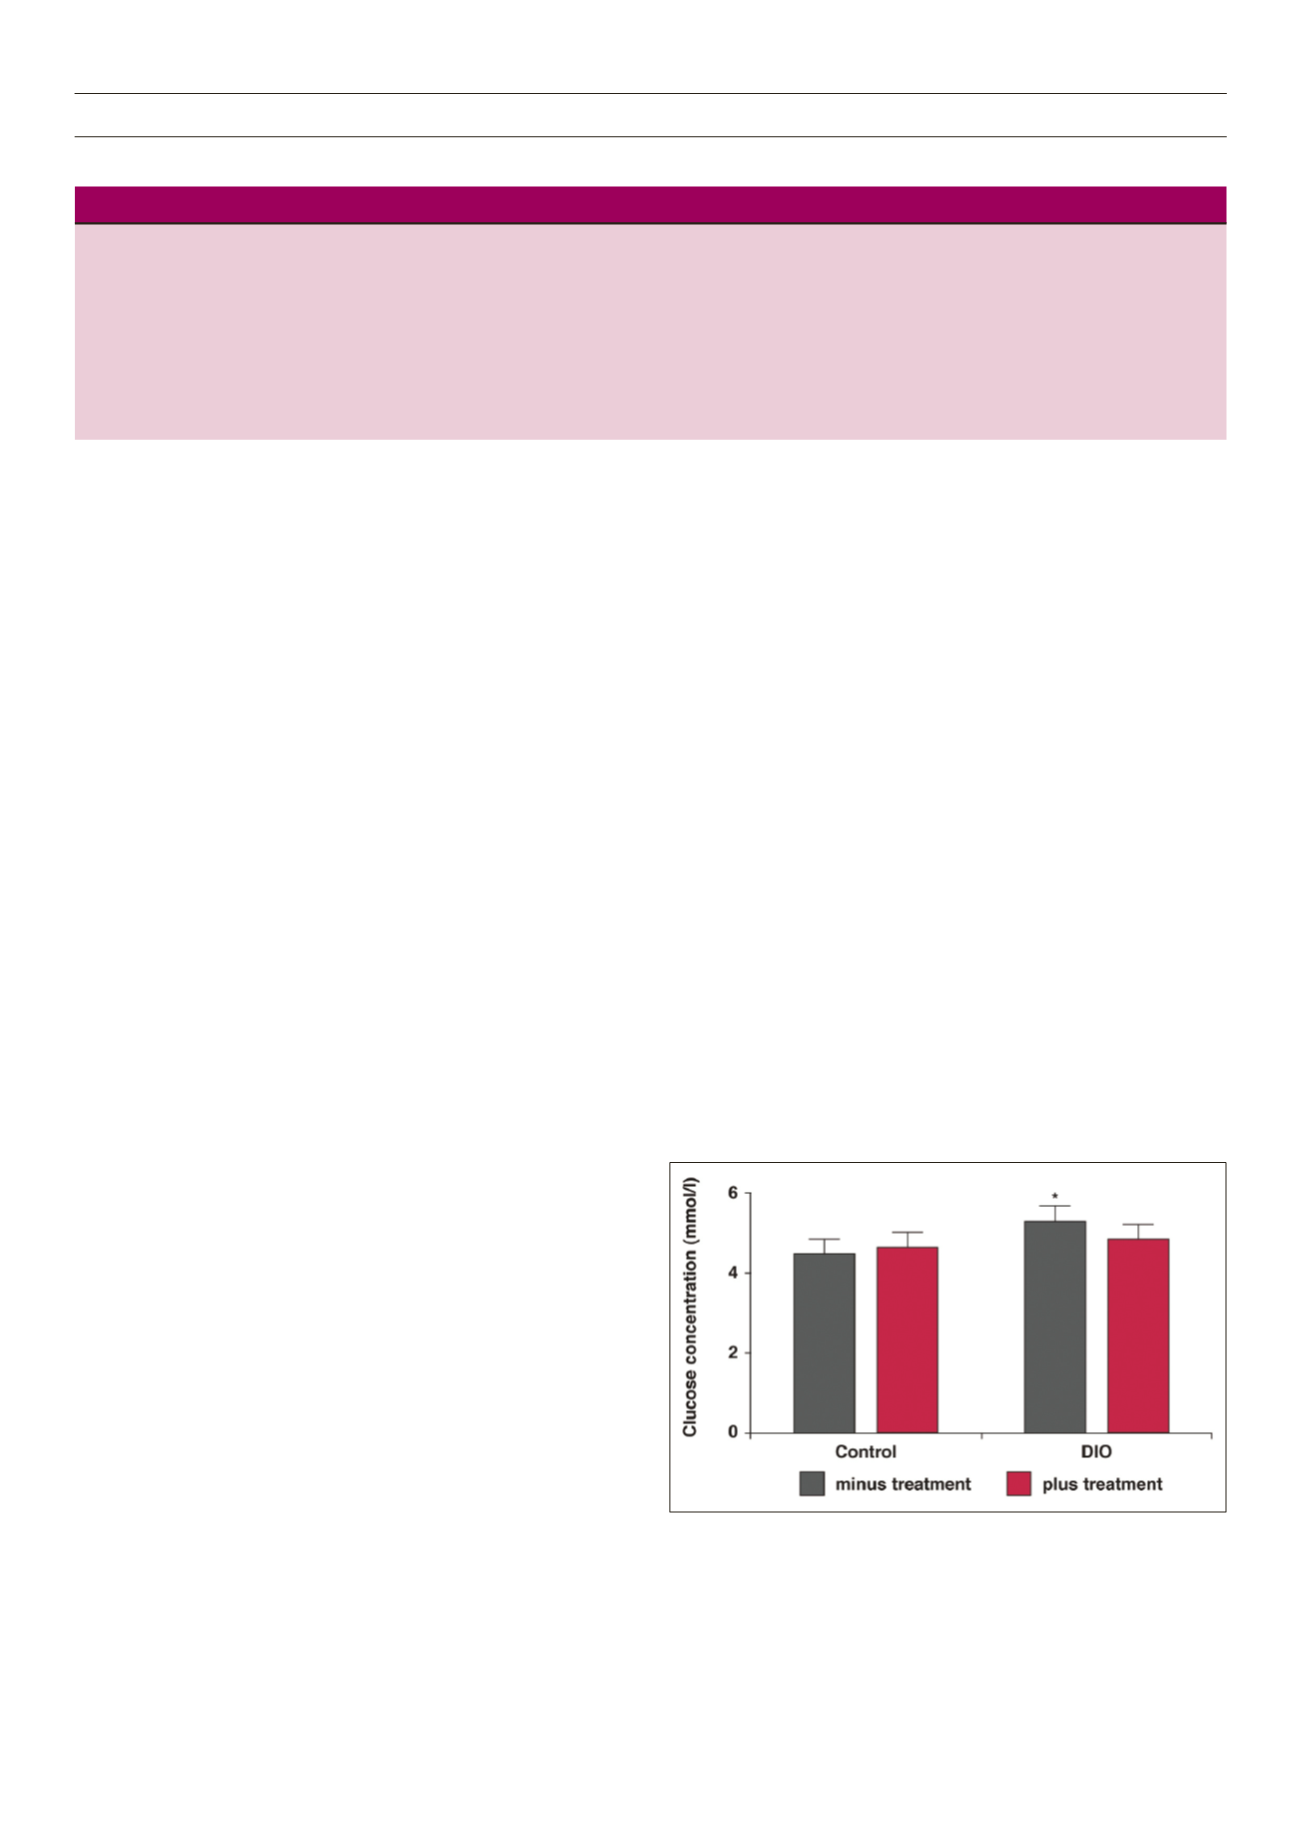
still significantly higher. However, as shown in Fig. 1, the two-hour
bloodglucose values after intra-peritoneal glucose toleranceanalyses
were significantly lower in the treated DIO animals, underscoring a
slight effect on blood glucose handling, as previously reported.
8
Infarct size
After 16 weeks of the obesity-inducing diet, the ex vivo perfused
hearts of the DIO animals presented with significantly larger infarct
sizes, calculated as percentage of the area at risk, than the hearts
from the control animals (DIO 49.48 ± 3.25 vs control 40.62 ±
2.21%,
p
< 0.05,
n
= 17 per group). The area at risk did not differ
between the groups and averaged 54.13 ± 2.21%.
An eight-week treatment regimewith
P glandulosa
in conjunction
with the diet significantly improved the ability of the hearts to
withstand a period of ischaemia, and smaller infarcts developed.
There was no significant effect in the hearts from control rats
(Fig. 2). Two-way ANOVA indicated a significant effect of the
treatment on infarct size (
p
< 0.01).
To confirm these results and rule out any effect of insulin
levels on the cardioprotective role of
P glandulosa
, we used a
mouse model with a conditional ablation of the insulin receptor in
cardiomyocytes.
14
Subjecting these animals and their normal C57Bl6
littermates to ex vivo perfusion and NICA, followed by reperfusion,
we found that the hearts of both control and CIRKO mice were
protected by the
P glandulosa
treatment. This was demonstrated
by the significantly smaller infarct size observed (Fig. 3). The effect
of this treatment was highly significant (
p
< 0.001,
n
= 9 per group)
as indicated by two-way ANOVA.
Analyses of proteins forming part of the insulin-signalling
cascade
Protection against myocardial damage induced by ischaemia–
Fig. 1.
DIO or control chow-fed rats for 16 weeks with
P glandulosa
treatment
for the last eight weeks were subjected to intra-peritoneal glucose-tolerance
testing after an 18-hour fast. Blood was collected by tail prick and analysed over
a 120-min period using a commercial glucometer. Data given are the 120-min
values. *
p
< 0.05 vs control and DIO plus treatment,
n
= 6 per group.
Table 1.
Biometric data – model 1: DIO.
Control
Control +
P glandulosa
DIO
DIO +
P glandulosa
Weight
433.7 ± 9.3
438.6 ± 9.3
507.7 ± 22.9***
534.3 ± 11.7***
Intra-peritoneal fat
18 ± 2.7
11 ± 1.8
28.0 ± 1.74***
34 ± 1.4***
Blood glucose (mmol/l)
5.42 ± 0.17
5.4 ± 0.18
6.4 ± 0.17*
5.6 ± 0.19
Serum insulin (μU/ml)
17.12 ± 0.8
14.07 ± 1.50
34.33 ± 9.06*
35.93 ± 10.21*
HOMA-IR
4.73 ± 0.71
3.40 ± 0.40
8.96 ± 2.65*
7.88 ± 3.30*
*
p
< 0.05 vs the respective control; ***
p
< 0.001 vs the respective control. Analysis by two-way ANOVA,
n
= 6/group.