
SA JOURNAL OF DIABETES & VASCULAR DISEASE
RESEARCH ARTICLE
VOLUME 17 NUMBER 2 • NOVEMBER 2020
51
A
B
C
D
E
F
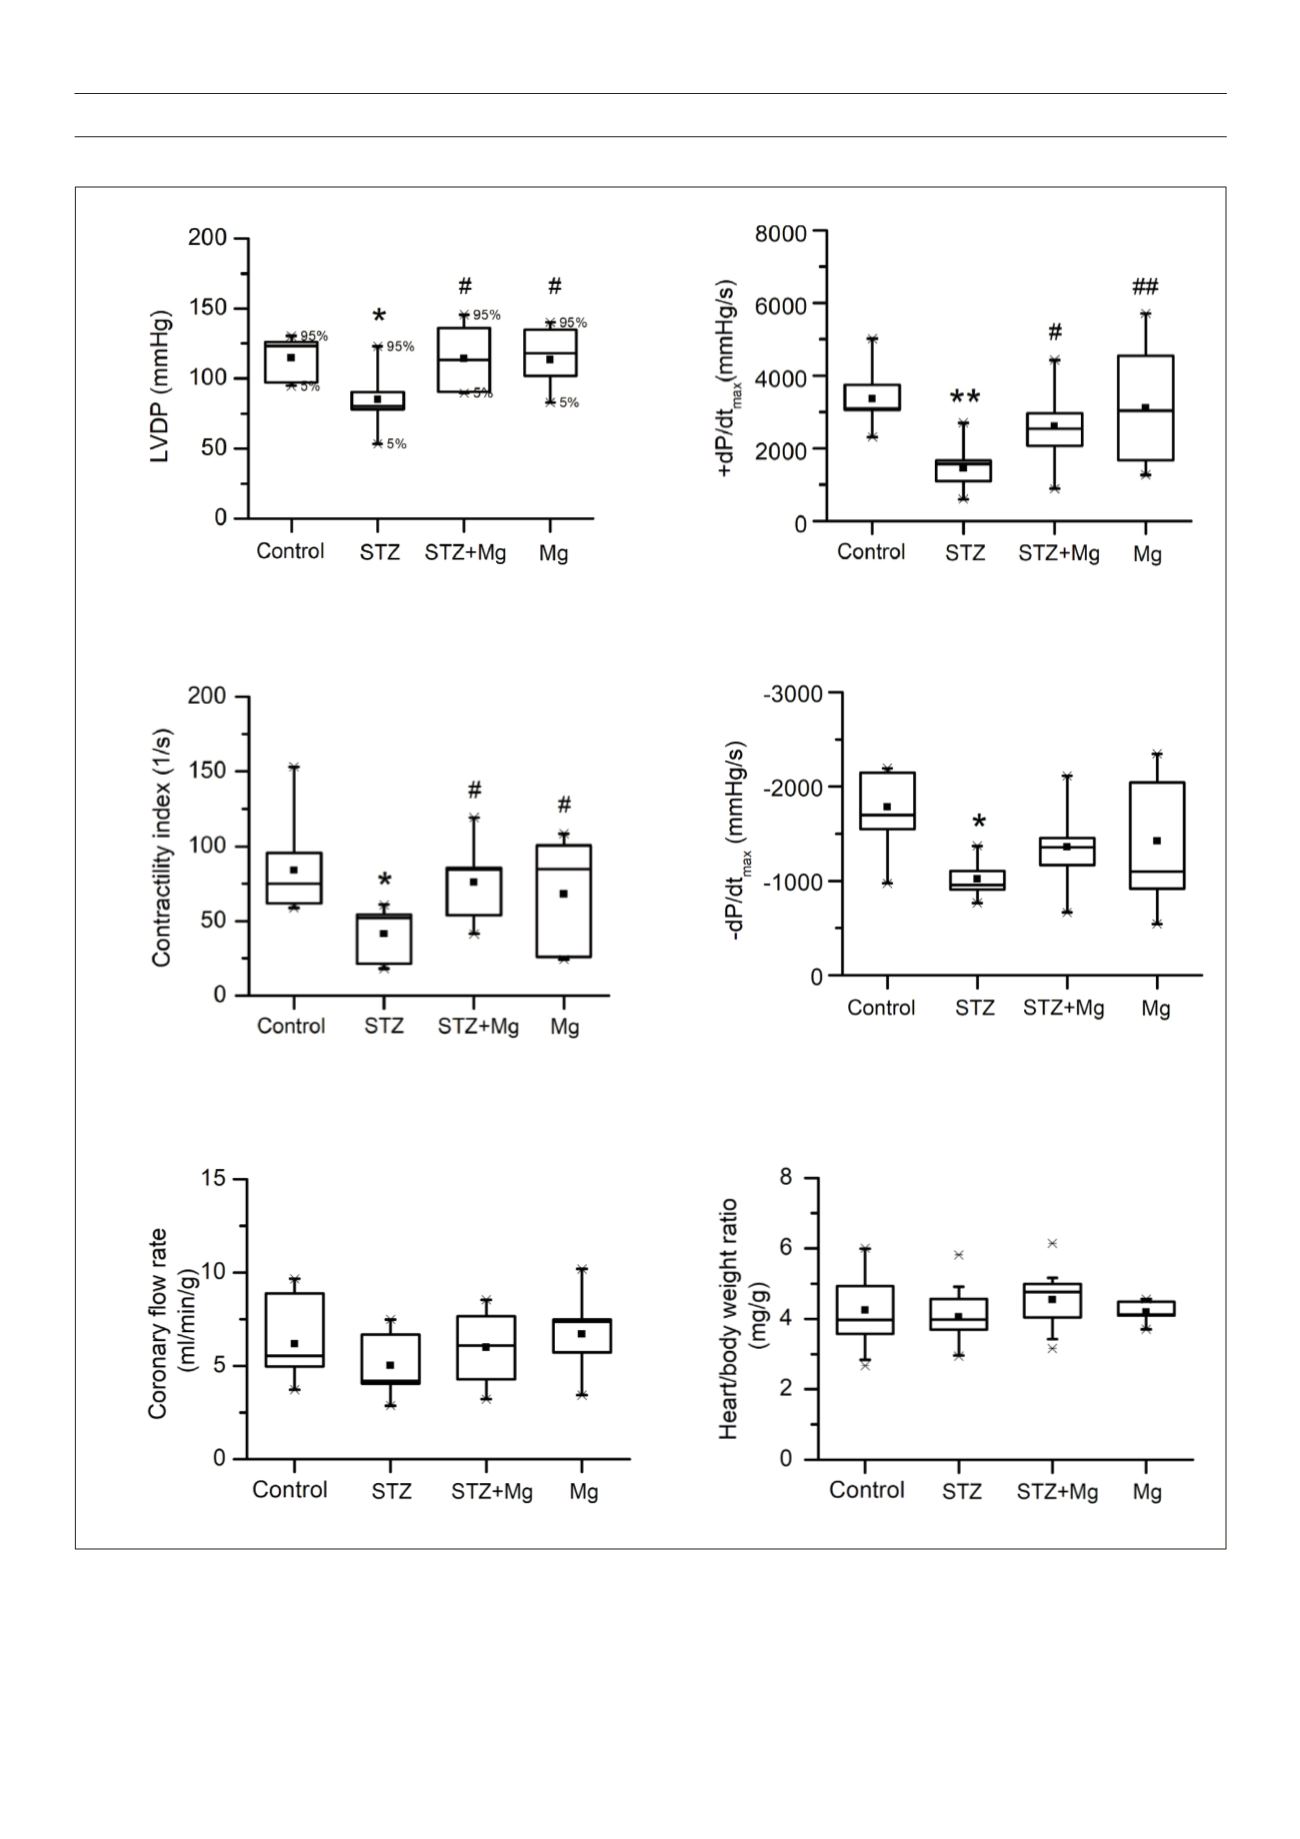
Fig. 2.
Effects of treatments on haemodynamic parameters. A: Left ventricular (LV) developed pressure (LVDP). B: Maximal rate of LV pressure increase (+dP/dt
max
). C:
Contractility index. D: Maximal rate of LV pressure decline (–dP/dt
max
). E: Coronary flow rate, normalised to heart weight. F: Heart weight to body weight ratio. Data
are shown as box plots and the mean (
n
);
n
= 6–9 per group;
*
p
< 0.05,
**
p
< 0.01 versus control;
#
p
< 0.05,
##
p
< 0.01 versus STZ.


