
SA JOURNAL OF DIABETES & VASCULAR DISEASE
RESEARCH ARTICLE
VOLUME 17 NUMBER 2 • NOVEMBER 2020
53
A
B
C
D
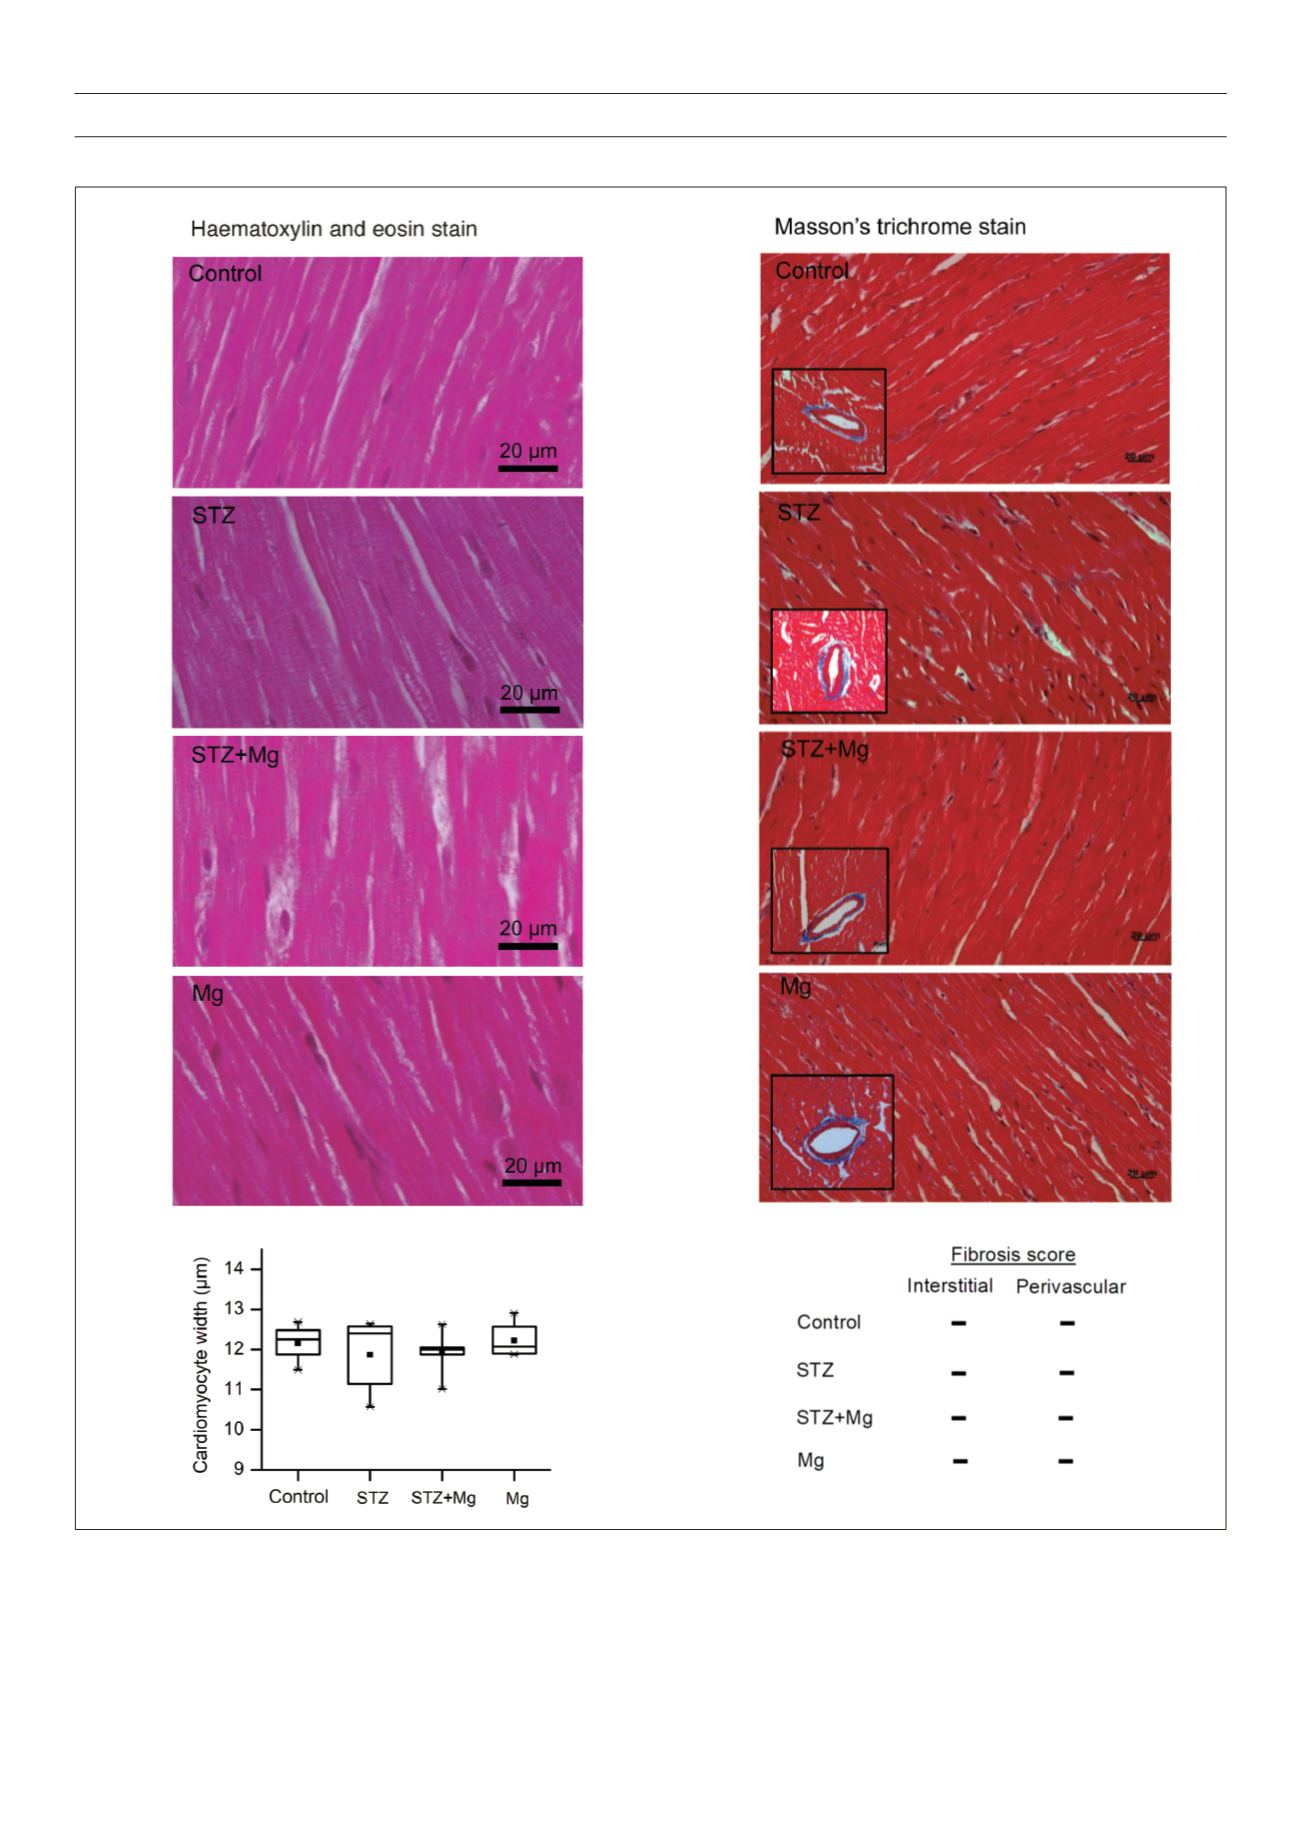
Fig. 4.
Histological analyses of ventricular tissue. A: Representative images of different ventricular tissue sections stained with haematoxylin and eosin (H&E). Scale
bar = 20 μm (× 40 magnification). B: Representative images of different ventricular tissue sections stained with Masson’s trichrome. Insets: Images of perivascular
tissue. Scale bar = 20 μm (× 40 magnification). C: Summary data of ventricular cardiomyocyte width. D: Arbitrary score of the degree of interstitial and perivascular
fibrosis: –,
none; +, mild. Data are shown as box plots and the mean (
n
);
n
= 6 per group.


